Data that is entered in a benchmarking system can be used to document your performance trends. This is a really straightforward process that shows the importance of the FM position in the organization. Without good benchmarking comparisons you may not realize that energy consumption and costs can be improved or which best practices may have the most impact on reducing your consumption. As you will see below, a case easily can be made for benchmarking that will justify the minor amount of staff time.
We have used the results from a case study from a client using the online benchmarking tool FM BENCHMARKING to illustrate how easy the benchmarking process can be, allowing the client to obtain key output reports in minimal time. In this case study, the client benchmarked energy performance and went through a three-step process:
- We noted which best practices had been identified by the benchmarking system at the end of their fiscal year one, which it then implemented in the next.
- We then benchmarked the same energy-related metrics one year after the changes were implemented (year two).
- By comparing the energy management results between each of those years, we measured the resulting improvement, which can be used to justify additional projects that would improve building performance.
In this example, we focus on two KPIs (key performance indicators) for the energy metrics that need to be benchmarked:
- KWH/Area
- Consumption-based best practices
We will look at these benchmarks and compare our implemented best practices in the first year to see if there are opportunities and changes we could make in the next that would reduce our consumption.
In Figure 1, we compare our KWH/Area performance to other large office facilities. This is always a good first comparison since it measures the energy performance directly and takes costs out of the comparison.
This allows you to see at a glance how your facilities compare with other office buildings. There are 171 buildings in this peer group with a median electrical consumption of 23.50 KWH per GSF. Our building (vertical yellow line) is in the second performance quartile with an electrical consumption of 18.94 KWH per GSF. Not a poor performance but there is also room for improvement. By looking at and comparing similar types of facilities, you will be able to make intelligent “data driven” decisions.

Filters: Type of facility (Office); large buildings (greater than 600,000 sq. ft.).
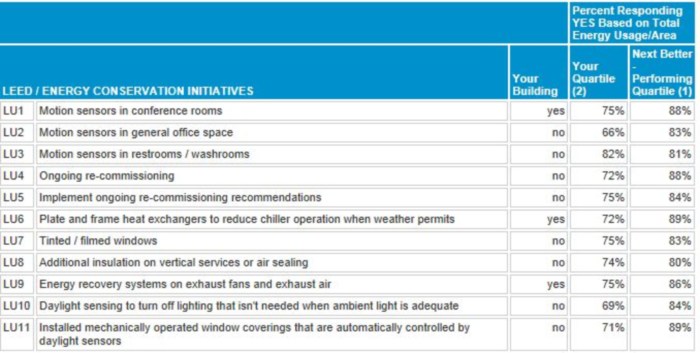
Let’s now look at the best practices we should implement and see what others in similar situations have implemented to improve their performance—then, we should be able to generate some ideas that would improve our performance. We will use the “usage- (consumption-) based” best practices to see what others in our quartile and the next better performing quartile have done (we could have used “cost-based” best practices instead.
Figure 2 is a partial listing of the best practices implemented by those participants in our second performance quartile (next to last column) and the next better performing (first) quartile (right-most column). There are actually about 25 best practices in the full table. After looking at just the first few we would consider recommending the implementation of:
- LU2 — Motion Sensors in the general office space. Notice the 14% jump in the implementation rate for 1st quartile performance. Motion sensor technology has become more reliable and less expensive to implement.
- LU4 — Ongoing Re-commissioning. This would seem like a very logical first step to identify which systems are not performing to design specifications. In almost any re-commissioning program you will find ductwork that has become disconnected, dampers that have become stuck open or closed, and defective or blocked temperature sensors. The re-commissioning program will identify additional work that can be justified and the benchmarking data supports that this is a good idea.

Filters: Type of facility (Office); large buildings (greater than 600,000 sq. ft.).
So, by looking at what others in the second quartile had done to get to the first quartile, we have an excellent idea of what we may need to implement in the next year.
In the real example, management approved the funding for the two projects listed above. We then benchmarked our performance again at the end of year two. Figure 3 compares our KWH/Area performance to other large office facilities at the end of the second year, just as we had done at the end of year one. Note that we are still in the 2nd quartile but our consumption has declined to nearly 1st quartile performance at 16.67 KWH per GSF. This is a reduction of more than 2 KWH per GSF (12%) over the entire building—quite an improvement. There are 169 buildings in this peer group with a median electrical consumption of 23.64 KWH per GSF so this is a very similar peer group compared to our first-year benchmark.

Filters: Type of facility (Office); large buildings (greater than 600,000 sq. ft.).
Not only can we show significant improvement, but we have documented our initiatives in the “usage based best practices” in Figure 4 (note the change in the third-to-last column from no to yes). Note that in year two we have implemented:
- LU2 — Motion Sensors in the general office space. Note that there we more people who had said yes to LU2 in year two than in year one for both the second and first performance quartiles—this shows that more and more people are implementing motion sensors, clearly in an effort to save energy.
Even though there were more people in both performance quartiles in year two, note that there still was a 13% difference between them, further validating that this best practice is a good one to get us from the second to the first quartile.
- LU4 — Ongoing Re-commissioning. As with the motion sensors, there are many more who have implemented ongoing re-commissioning in year two than year one in both performance quartiles, and especially in the second quartile. Much has been written about the benefits of ongoing re-commissioning over the past few years, and more and more FMs are seeing this as a very logical first step to identify which systems are not performing to design specifications.
Filters: Type of facility (Office)
Even though our building has improved significantly, we still are not in the first performance quartile for utility consumption. If we look again at Figure 4, focusing on best practices that we have not yet implemented and where there either is a big difference between the first and second quartile, or where both quartiles are in the 80% or higher bracket, we will get clues as to what else we may want to try. For example, we may want to look at LU7 (getting film for our windows) and LU10 (daylight sensing to turn off lighting that isn’t needed when ambient light is adequate). We should see if either of these best practices may be feasible for us to implement in our building.
Conclusions
Using the results from benchmarking, the FM can make proven recommendations that will reduce energy consumption. The company in this real example achieved:
- Electrical cost savings by implementing the best practices recommendations.
- A better performing, more sustainable, facility.
- Improved levels of service.
This article was last reviewed and edited by FMLink in 2017.