Space Utilization — Definitions and Process
Facility Managers Roundtable (FMRT)
Step 1 – Space Benchmarking Definitions
Good Definitions are the cornerstone to obtaining good data. Here are the critical space benchmarking definitions. Click here to view the full set of benchmarking definitions.
Data in this section are used by the participants to identify similar organizations and to normalize costs. The questions are relatively straightforward and should be part of the key performance indicators in any facilities organization.
- Total number of buildings.
- >Total gross square feet of all buildings (000)
- Total rentable square feet of all buildings (000).
- Total number of building occupants on all shifts.
- Total number of office occupants.
- Total number of 1st shift building occupants.
- Percent of gross square feet that is utilized. Utilized space for this study includes workstations and production space that is occupied by a user.
- Total number of unassigned (hoteling type workstations) with network connectivity.
Step 2 – How Do I Compare With Others…
From this data we can obtain some idea of how effectively space is being utilized at a particular site. One of the summary charts in a benchmarking report on space utilization would look like this
Step 3 Using This Information…
You’ve completed your space data collection and performed the calculations. Here are a few questions you should ask yourself
- Where do you stand on this chart? Are you above the median or below it?
- Could you explain to management why your position on the chart is just right or needs to be changed?
- What are some of the reasons that explain your position on the chart?
- Is your company expanding or contracting? Perhaps you want a low utilization rate for expansion next year.
Step 4 – Some Best Practices…
You need a well thought out and easy to follow space standard program. FM’s have better things to do than performing space cop functions. We know many Fortune 500 companies that can count their approved from standards on one hand. Do you have a chargeback system that encourages users to be prudent with their use of space? There is nothing like paying for space that encourages effective utilization of it. How carefully do you utilize free services? Nearly all organizations that are below the median have a charge back system for space.
Metrics from the Facility Managers Round Table (FMRT)
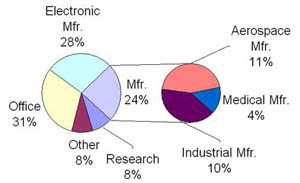
In 2004 there were 94 unique sites in the FMRT with a median size of about 1,400,000 million square feet. See the chart below to see how the group looked by industry type.
SPACE METRICS
- Space Utilization 430 Gross Square Feet per Occupant
- Cost Metrics
- Utilities $2.17 / GSF
- Custodial $1.33 / Cleanable SF
- Maintenance $1.82 / GSF
- Parking and Paving $1529 / Acre
- Groundskeeping $3405 / Acre
- Security $0.73 / GSF
- Mail Services $0.22 / GSF
- Environmental Health and Safety $0.35 / GSF
- Fixed Costs (Includes: Building, Leasehold Improvements, Furniture/Equipment) $ 3.71 / GSF
MOVE / CHURN COST METRICS
- Box Move Costs $317 / Person Moved
CUSTOMER SATISFACTION
- Satisfaction With Overall Facilities Services 3.80 on a 1 to 5 scale