I have just returned from IFMA’s Facility Fusion conference, held in Washington, DC. We had a lot of traffic at the FM BENCHMARKING booth and one of the most common questions was, “How do I get started with benchmarking?” It seems that many of our booth visitors, and probably many FMs that are reading this article, have difficulty finding time and getting started in the benchmarking process.
I think part of the problem is that the forms and the amount of data needed to fill them look formidable. No matter how easy some of the benchmarking tools make the data entry process (and some are very easy!), the task often looks challenging. In each conversation with each visitor, I suggested an approach to help get started. We have used examples from FM BENCHMARKING to illustrate how easy the process is, but this approach should work with almost any benchmarking program. This approach will allow you obtain the key output reports in the minimum amount of time.
I pointed out to our visitors that with just a little data, you can see where you stand on about 95% of the operating costs. For those who are not currently benchmarking, getting 95% of the portfolio costs in a benchmarking program is a significant achievement. Figure 1 shows the results from about 700 benchmarking participants. Note that by benchmarking just your Utilities, Maintenance, Custodial, and Security costs the participants are benchmarking 97% of their operating costs.

Over and over again I was asked, “So, what do I really need to do to get started with benchmarking and get some useful output?” In FM BENCHMARKING we call these inputs “critical” data fields. By inputting these critical data fields you will be able to see how your performance compares with others on most of the key performance indicator charts in the shortest possible time.
The other catch… You actually have to have some data available for input. A few visitors to our booth indicated they have no financial data, do not have the area of their facility, did not have the occupancy of their facility, the year built, or other key components needed to benchmark. This is a problem no benchmarking tool will be able to resolve for you. Support is needed from your financial services groups to obtain this data. If you have fundamental cost and building attribute information available, most participants should take less than one hour to all critical information in a benchmarking system.
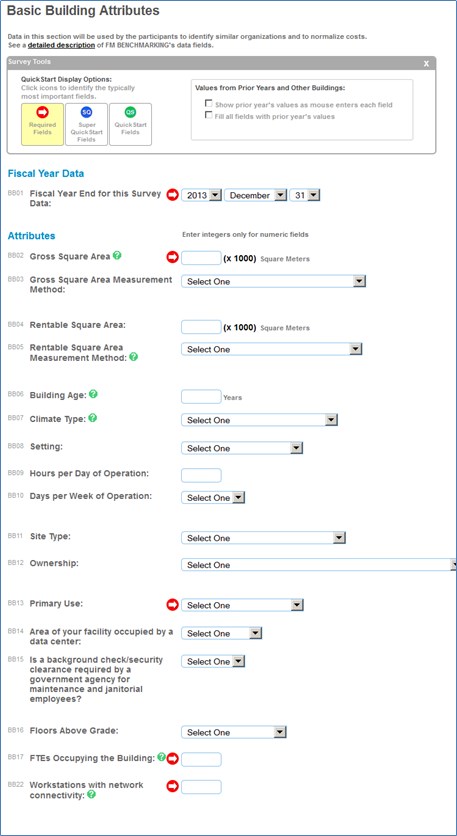
There are quite a few inputs on most Building Attributes input form and we are recommending you input as many as possible so you can filter your data in the output reports; but you don’t have to. Just a few key data fields are needed such as:
- Fiscal Year of construction
- Gross Area of the facility
- Primary use
- Number of occupants
- Workstations with network connectivity
Figure 2 shows the suggested critical inputs for the Building Attributes area identified with the red circle.
Other fields such as the Building Age, Setting, Site type, Ownership, Security background clearance, Area occupied by a data center, etc. are also encouraged since they allow filters to be applied on the output reports. Most of the input fields on this page are readily known by most facilities managers for their buildings.
In case you don’t have all your data readily available, be sure you get a benchmarking tool that enables you to input your data over time.
What does a facility manager obtain after entering this basic information? For a little bit of your time you will receive quite a bit of valuable feedback. By inputting the total dollars spent on utilities, maintenance, janitorial and security, FMs will be able to chart how their facilities compare on the major KPI charts of Cost per Area or Cost per Occupant for:
- Utilities
- Maintenance
- Janitorial
- Security
And by adding some of the Building Attribute data, the FMs will be able to apply filters to their reports so they can ensure they can compare apples-to-apples.
That is a significant achievement for about one hour’s worth of time.
To obtain the maximum benefit from benchmarking tools you will want to explore areas where your building is strongly over- or under-performing other buildings. To do that, you likely will need to return and input additional data for those areas. Your then can look at your output charts and discuss your organization’s performance with others in the facilities organization.