This is our fourth article in the past four months discussing benchmarking for verticals—this one is about Security. The prior articles reviewed:
Most of the principles described below apply to all verticals, not just that of security.
First, we should discuss what is meant by verticals. An organization that is considered a “facilities vertical” would mean any company in a common business platform with a large quantity of properties in their portfolio. Some examples of companies containing verticals are banking (branch offices, data centers, call centers, payment processing/mailing centers), office facilities, healthcare (hospitals, medical offices, laboratories), retail (large box stores, grocery, mall anchors, small retail), telecommunications (data centers, call centers, retail), shipping (e.g. FedEx, UPS, US Postal Service), and many others. Verticals can use benchmarking and benefit in a number of ways such as:
- Multiple facilities of similar types that can be benchmarked (e.g., a large box retail store can be benchmarked with all the other large box retail stores to see how they compare).
- Similar competitor facilities can be benchmarked (large box retail such as Sam’s Club and Costco could benchmark to compare performance).
- Best practices, either from internal or external benchmarking, can be identified or applied to benefit the entire organization; most organizations do not regard facility performance as a core business so they are normally quite willing to share, even with the competition.
- Operating performance of the entire organization is improved by applying the identified best practices in a shorter period of time than otherwise would be achieved.
Vertical organizations frequently have the same reasons for participating or joining in the benchmarking process:
- Benchmarking is a way to justify the operating efficiency of a large component of the portfolio. Executives at all levels in the organization understand that real estate costs are normally one of the largest components of the expense profile so they need good data to show which facilities are operating in an efficient manner. If you want to obtain approval for additional capital renewal funds or just hold on to your existing operating budget, benchmarking can help. Benchmarking data can be used in a variety of ways. Just a few are listed below:
-
- Increased staffing for security personnel.
- Additional funds to modernize or replace cameras and motion sensing devices.
- Additional operating funds to increase hours of operation or provide for more rounds of critical facilities.
- Promoting Security/Facilities Managers managing high-performing facilities.
- Justifying capital expenditures.
-
- Identifying high, medium, and low cost crime profiles. Some facilities may be in higher crime areas than others; benchmarking can help identify the cause and the need for additional staffing at these facilities. A filter showing the cost profile for those facilities in high, medium, and low cost crime areas could help obtain additional resources and avoid treating the security profile with a “one size fits all” approach.
- Organizational cost pressures affect security services as much as any organization. Every organization we are working with is under some pressure to perform better year over year. Benchmarking creates an easy forum to share their practices within the organization. Internal benchmarking for verticals is an easy first step:
-
- No confidentiality issues.
- The security services groups probably know each other and each other’s facilities.
- There is no jargon to learn.
- The cost reporting system is common across the organization so the data is easy to exchange.
-
- Keeping Security Services at a high performance level without degrading services. Benchmarking of security for verticals, whether internal or external, is a very helpful process that shows and justifies the cost structure. Consider several possibilities based on how well your security services performance is doing in the benchmarking analysis:
-
- 1st (best) quartile: You are in a great place to explain and justify that further costs reductions can only be obtained by degrading security services. You can use benchmarking to counteract the pressure to reduce costs.
- 2nd or 3rd quartile: Your security services costs could be in a better place. There have got to be some best practices you could apply from the peers that are in the 1st quartile. You can use benchmarking to help justify the expenditure.
- 4th quartile: Unless you are in a very high crime area you should be looking very intently at the best practices of the peers in the lower cost performance quartiles. Again, benchmarking should provide the justification.
Much like any other facility organization, verticals have the same issues getting started with benchmarking. Most organizations today have experienced
-
- Staffing cuts.
- Very busy staff (the remaining staff members are often performing the jobs of two or three people).
- Long hours that seem to get longer with every budget cut every month/year.
Benchmarking may be one way out of the downward spiral since it shows which facilities:
- Have high or low cost security profiles.
- Implemented the best practices for their lower cost profiles will be lost.
-
Benchmarking is a great opportunity to improve the whole organization and improve security operations without just “getting by with less.”
The benefits to benchmarking would certainly appear to outweigh the negatives. Here is a suggested approach to help you to get started. We have used examples from FM BENCHMARKING to illustrate how easy the process should be and this approach will allow you obtain the key output reports in the minimum amount of time.
First of all, benchmarking can be an intensive effort, so focus on what is important! For verticals, what is important are the services included in your scope of work.
Security is nearly always normalized on a cost per area basis and a cost per occupant basis. In this example we will compare a vertical financial services organization on its cost per area basis. It is also important to compare the normalized security costs with a relevant peer group. Figure 1 shows the security costs using the filter criteria listed below (the yellow bars represent your buildings).

Filters: Type of facility (Financial Services, 125,000—600,000 GSF)
Figure 1 allows you to see at a glance how your facilities compare with other financial services facilities. There are 299 buildings in this peer group with a median utility cost per square foot of $1.22 and a first quartile performance of $.97 per square foot.
Note that most of the facilities are in the first quartile, but there are three facilities in the second quartile with one facility in the third quartile. The highest cost facility in the third quartile is really worth looking at, as significant improvements should be able to be made. The facility is not in a high crime area and has the same operating profile as the other facilities. Prior to the benchmarking program, the management team at this facility thought they were doing “just fine.” This is just one example of the power of benchmarking to produce organizational changes.
To reach the second or first quartile, or move the high cost facility into the second quartile you could begin looking at the best practices and the implementation rates. In Figure 2, we ran the implemented best practices for the highest cost facility, the one in the third quartile of the chart, to see what they had done. The table below shows no implementation for any of the first five best practices (there actually are 25 more). In fact it shows that less than 40 percent of the guard force is certified. It also shows the implementation rate for the 3rd quartile and 2nd quartile groups.
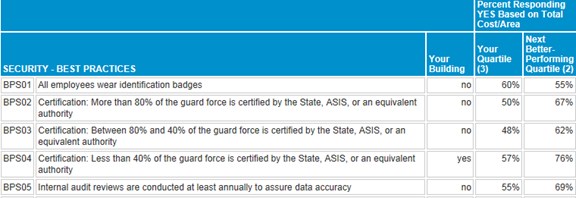
Type of facility (Financial Services, 125,000—600,000 GSF)
After reviewing just this data we concluded that it should not be too difficult to radically improve the performance of the high cost buildings. Using the results from this table, the security services group can make proven recommendations that would help achieve significantly improved performance or move toward first quartile performance. Again, this is win-win for the entire organization. The company will achieve cost savings from the security services improvements and improved levels of service; the Security Manager and FM will improve their profitability by more effectively utilizing their workforce, and there will be improved occupant satisfaction with Security which benefits everyone.