April 2018 – In last month’s article we reviewed electric costs and explained that they usually represent the largest or second largest single component of an FM organization’s spend. We also explained that service providers are in a unique position to help their clients reduce or control these costs and reviewed the first two steps in the process that usually produce a successful outcome.
- Discuss the approach with your client
- Benchmark energy consumption and costs
This article will review steps 3 and 4, which provide opportunities to focus attention on areas that have the highest payback and develop implementation strategies with your client. Next month, we’ll cover steps 5 and 5.
- Benchmark best practices
- Analyze the results and develop recommendations
- Look carefully at renewable energy options as the cost of implementation is decreasing
- Meet with the client and develop priorities and funding
Figure 1 shows the energy cost for “our building” is $4.55 per SF and the median value is $3.78 per SF. Our building’s cost is shown in yellow and is near the middle of the third quartile. It is obvious that improvements can be made.
Knowing how your clients’ buildings’ utility consumption compares to other similar buildings is only the first step. If you find that they are underperforming, see how utility best practices can be applied to see what other buildings are doing that you are not.
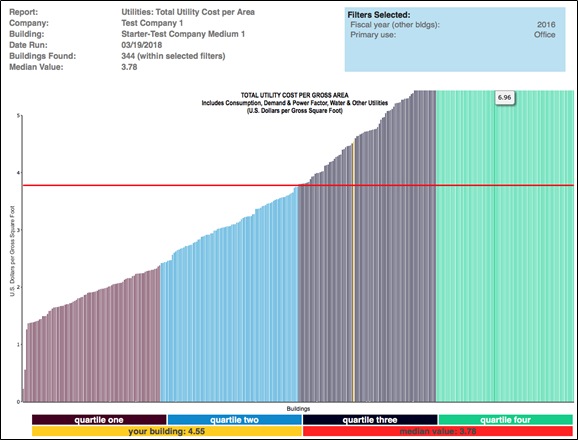
Filter: Type of facility (Office)
Provided courtesy of FM BENCHMARKING
But where to make the improvements? This is where benchmarking of best practices can lead us to make good decisions on which programs would have the most impact.
Consider Figure 2 below. This shows the percent of Utility Best Practices implemented by the peers in our building’s third quartile compared to the percent implemented by the next better quartile (2nd). Some programs don’t look like there is much of a difference between the second and third quartiles, but consider UB02, motion sensors in the general office space. There is an 8 percent change from quartile 3 to 2. Or consider UB04, initial commissioning. Here there is a 7 percent change from quartile 3 to quartile 2. These two have the best chance of the four to get our building into the second quartile.

Filters: Type of facility (Office)
Provided courtesy of FM BENCHMARKING
Let’s look a little further down the list. In Figure 3, we see that Energy Recovery Systems, UB02, shows a 19 percent spread between our building’s quartile and the next quartile. Of the best practices shown for our building, UB02 looks like it would be the most effective.

Filters: Type of facility (Office)
Provided courtesy of FM BENCHMARKING
There are many more best practices for utilities, and additional ones that can apply to other FM areas (e.g., maintenance, security, janitorial, etc.). These examples show the power of benchmarking in making data driven decisions. Additionally, You can be reassured that the proposed work will successfully pay off since it has worked successfully for the peer group in the second quartile.