Can you easily show your building performance trends? Did you know that data entered in a benchmarking system can be used to document your improvements? This is a straightforward process that shows the importance of the FM position in the organization. Without good benchmarking comparisons you may not realize that maintenance costs can be reduced or which best practices may have the most impact on improving your maintenance operations. As you can see, a case can be easily made for benchmarking that will justify the minor amount of staff time you may need to spend.
We have used examples from FM BENCHMARKING to illustrate how easy the process should be and how this approach will allow you to obtain the key output reports in a minimum amount of time. In the following example, we benchmarked maintenance performance and noted which “best practices” had been implemented in 2010. Then the benchmarking results can be used to show areas for improvement that can be used to justify additional projects that would improve the performance of the building portfolio.
Focus on just two KPIs (Key Performance Indicators) for the maintenance metrics that need to be benchmarked:
- Maintenance Cost per Area
- Maintenance Best Practices
The process is straightforward:
- Look at our benchmarked maintenance costs for FY 2010.
- Look at which best practices we could implement.
- Implement the recommended best practices in 2011.
- Review our FY 2011 benchmarked costs to see how the implemented best practices affected our performance.
Figure 1 shows our maintenance performance compared with our peer group of other large (>600,000 GSF) office facilities. This allows you to see at a glance how our facility compares with other office buildings. There are 172 buildings in this peer group with a median maintenance cost of $2.24 per square foot. Our building is in the middle of the third quartile with a maintenance cost of $2.40 per GSF—not a very good performance—but we see there is room for improvement. By looking benchmarking data in this way and comparing similar types of facilities, you will be able to make intelligent “data driven” decisions, as we are about to do.
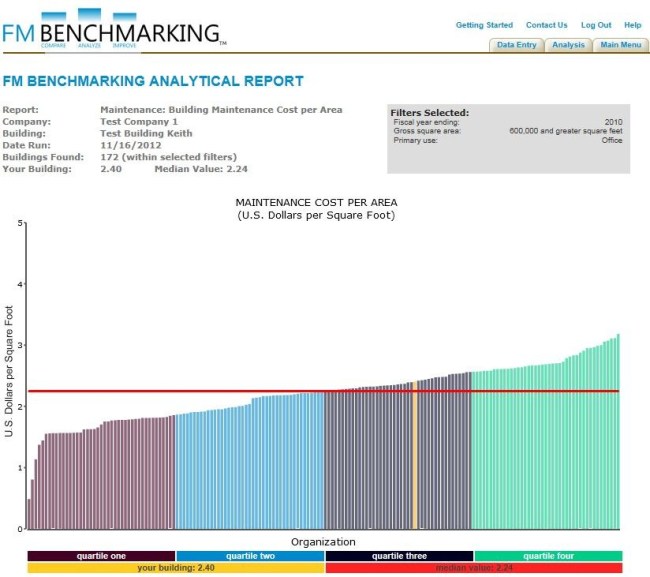
Filters: Type of facility (Office)
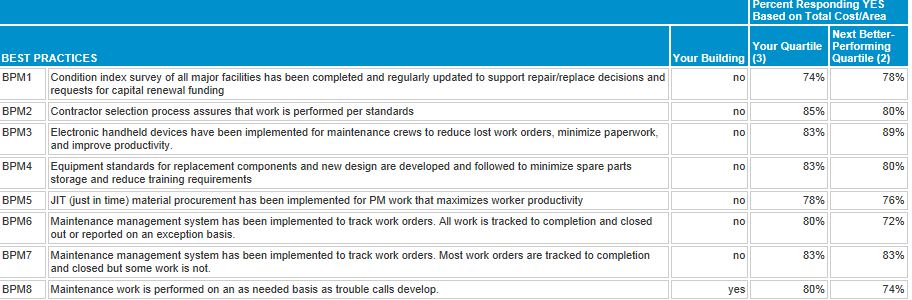
Let’s look at the best practices we have implemented and see what others have implemented so we can generate some ideas that would improve our performance. We will use the cost performance data to see what others in our quartile and the next better performing quartile have done.
The table shown below is a partial listing of the best practices implemented by those participants (those in similar buildings) who are either in our performance quartile or the next better performing quartile. There are actually more than 20 best practices in the full table. After looking at just the first few we might consider recommending a variety of the best practices shown there; due to some additional reasons (e.g., cost to implement, etc.), two of the best practices were what we decided to try first:
- BPM1 — Condition index survey of all major facilities.
This shows a 4% jump in the implementation rate between the 3rd and 2nd quartile performance. A condition index survey is a reliable and accurate way to develop a prioritized list for capital funding needs. With a condition index survey you have a better opportunity to adequately fund the necessary facility improvements. - BPM3 — Electronic handheld devices.
This shows a 6% jump in the implementation rate between the 3rd and 2nd quartile performance. Many studies have been conducted regarding improvements in workforce productivity and this would seem like a logical program to implement. Most studies show a two year or less return on investment, improved productivity, and higher quality maintenance work.
Filters: Type of facility (Office)
So by looking at the more than 20 best practices we can easily develop a program of top priority items that will reduce our maintenance costs and improve the maintenance quality. This gives us an excellent idea of the types of programs to implement in fiscal year 2011.
Management approved the funding for our recommend projects in early 2011. The programs were implemented and we benchmarked our performance again in early 2012 for the calendar year ending 2011.
Figure 3 compares our maintenance performance to other office facilities in the same manner as Figure 1 except that this is for 2011 instead of 2010. Note that we are now in the 2nd quartile and our maintenance costs have declined to $2.25 per GSF. This is a reduction of $0.15 per GSF over the entire building… quite an improvement. There are 170 buildings in this peer group with a median maintenance cost of $2.29 per GSF so this is a very similar peer group compared to our 2010 benchmark.
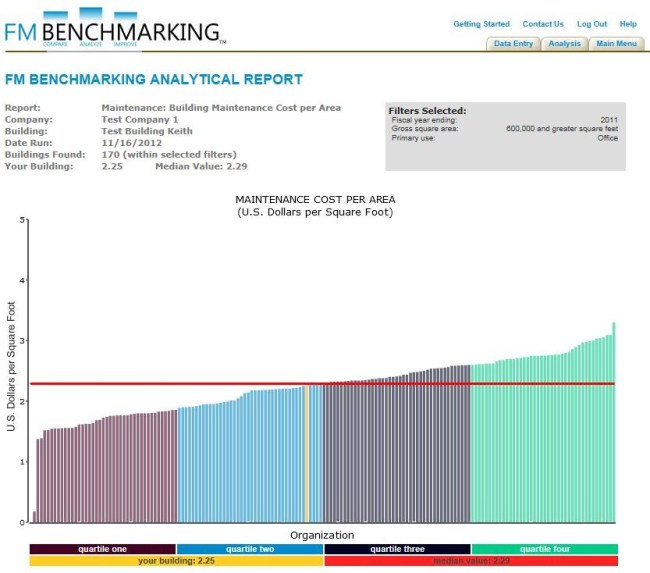
Filters: Type of facility (Office)
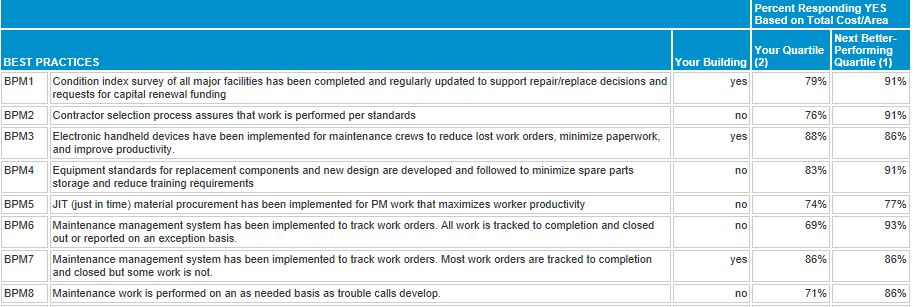
Not only can we show significant improvement, but we have documented our initiatives in the “maintenance best practices”. Note that in 2011 we have implemented:
- BPM1 — Condition index survey of all major facilities.
- BPM3 — Electronic handheld devices.
Again the benchmarking data supports our decision to implement these best practices and the implementation rates are even higher for the 1st quartile. This means a higher percentage of our peer group has also implemented this best practice. We are in good company with steadily improving performance.
Filters: Type of facility (Office)
In Figure 4, we look again at the best practices table to see what else we may want to consider modifying in 2012, perhaps to get us into the first performance quartile. Of the five best practices shown that we have not yet implemented, the ones where we might get the most significant bang-for-the-buck would be BPm2 (contractor selection process assures that work is being done according to pre-established standards) and BPM6 (ensuring that our CMMS system is used to track all work orders). Both of these resulted in over 90% of those in the first quartile who had implemented them, with less than three-quarters of those in the second (our) quartile, implying that these would be a good way to jump quartiles to the next better one. More importantly, we come to realize that benchmarking is a continuous improvement process—one is never done, as there always is more to do to get better!
Conclusions
Using the results from benchmarking, the FM can make proven recommendations that will reduce maintenance costs and improve maintenance performance. The company achieved:
- Maintenance cost savings by implementing the best practices recommendations.
- A better performing maintenance workforce.
- Improved levels of service or no degradation of service.