Part One was published last month. Click here to see it.
In last month’s article, we used a real manufacturing facility, located in Florida, to benchmark security costs. We started by looking at several filters to understand its performance better. Initially we filtered by:
- Size of facility (Large: >600,000 GSF)
- Type of facility (Manufacturing)
- Security clearance required (Yes)
As a rule, you want to use as few filters as possible, as the more filters you use, the larger the data sample will have to be (in order to have enough buildings in your filter set). It is ok to test many filters, but keep the number to be applied simultaneously to a minimum so that you have enough buildings in your filter set to analyze properly. Thus, finding the correct filter set is critical. See last month’s article for more information on defining the correct filter set.
In our analysis last month, we looked at how our performance changed with each of these filters and concluded that the combination of filters: size, type of facility, and security clearance had the most significant impact on our peer group performance. In reality, what we are doing with these various filter options is changing our peer group for comparison purposes—by modifying the filter set, we are modifying the peer group. If you haven’t compared your facility with the right peer group, the charts will not provide a realistic picture of your benchmarked costs. Comparing data or even processes isn’t a very effective way to improve your performance unless the comparisons are made with a relevant peer group.
Getting Results: Integrating Best Practices into the Benchmarking Process
As a result of our analysis, let’s say you have looked at the results from enough filters and you are comfortable that you are comparing your building with the right peer group. So, are we done with our analysis? On the one hand, yes, we’ve created a valid scorecard and can see where our facility stands in comparison to other similar facilities. But is there more we can do? Is there a way to improve our facility’s performance? Yes on both counts!
To improve our facility’s performance, we must look at the best practices being employed in similar facilities (in our peer group) that are outperforming ours. We then can compare them to the best practices we have implemented in our facility. Benchmarking can be used for that as well. To illustrate, let’s continue with the same manufacturing facility in Florida and see which best practices it has implemented and how they compare with those of their peer group.
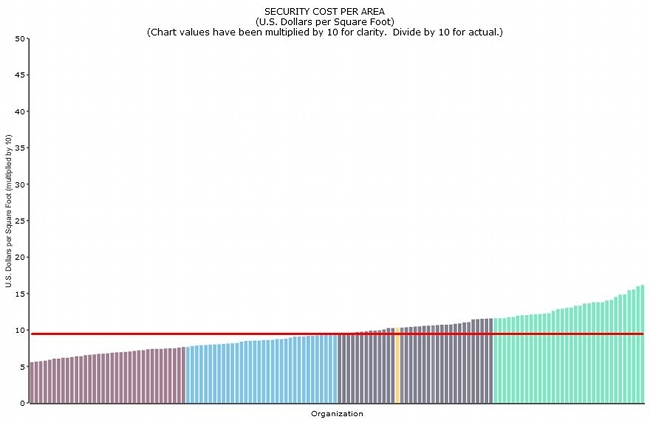
In Figure 1 below, we see that the cost for our building is $1.03 per gross square foot (GSF). In the graph, we have shown each building as a different vertical line; each building is then placed according to its rank into our Quartile system. The best performing buildings are in the first Quartile (on the left side); the red line, between the second and third Quartiles, is the Median. Our building’s security costs (yellow line) are in the 3rd Quartile about one-third of the way between the 3rd and 4th Quartiles. This sample has been filtered for:
- Size of facility (Large: >600,000 GSF)
- Type of facility (Manufacturing)
- Security clearance required (Yes)
We’ll look at the cost-based best practices for this exercise since most CFOs and others in senior management are highly focused on cost metrics. We’ll look at the some of the best practices that have been implemented at our facility and by our peers in our Quartile (3rd) and those in the next better performing quartile (2nd). There is certainly room for improvement. By looking at which best practices have been implemented we may see some options that we could implement at our facility to improve the performance that may help move us to the 2nd or perhaps the 1st Quartile.
Listed below in Figure 2 are just a few of the best practices from the database. At our manufacturing facility, we have not implemented item BPS5 (Internal audit reviews are conducted at least annually to assure data accuracy). Note that 69% of our 3rd Quartile peer group has implemented this item and that 80% of our 2nd Quartile peer group has implemented this best practice. This would appear to be a good opportunity to improve service and reduce costs at the same time.
Note item BPS7 (Major entrances and key access points are monitored by CCTV). Of the items listed, this best practice has the greatest differential of implementation between the 3rd and 2nd Quartiles (60% and 77% respectively for a 17% difference). Implementing this item may be a top priority issue for improving performance and reducing costs to obtain 2nd or even 1st Quartile performance.
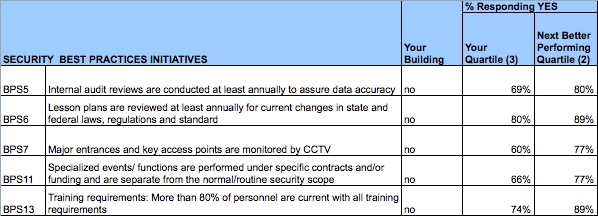
Looking further down the list, Note item BPS13 (Training requirements: More than 80% of personnel are current with all training requirements). This best practice has also has a relatively high differential of implementation between the 3rd and 2nd Quartiles (74% and 89% respectively or a 15% differential). Implementing this item should also be considered a top priority issue for improving performance and reducing costs.
What is really happening is that the FM is able to develop very carefully a targeted peer group and then see what has been done to achieve results. This is benchmarking with integrated best practices—it shows what options you can implement to improve your building’s performance.
Looking at facilities without good peer group comparisons can be a major waste of time. Last month, we saw that you need to apply tools iteratively to define the appropriate peer group for your specific situations; this month, we saw that by creating an accurate scorecard, while great for knowing where you stand when compared to others, doesn’t help your building perform better—that’s where the best practices come in.
By comparing the results with costs and best practices, we will have the clearest idea of which best practices to implement. This is the only way one can use benchmarking to improve a building’s overall performance and reduce costs without cutting service.