Many FMs are often seeking benchmarking data to measure how they organization is performing. When asked about what they want to learn they will often reply that a table or chart showing their performance compared to others what they want.
However, not all charts provide a realistic picture of your benchmarked costs. Comparing data or even processes isn’t a very effective way to improve your performance unless the comparisons are made with a relevant peer group. Let’s take a manufacturing facility located in Florida and compare their security costs with some different peer groups to see how they are doing.
We’ll use security cost per area as the key performance indicator (KPI) since this normalizes the cost of security services against the actual area secured. In Figure 1 below, our security costs are $1.03 per gross square foot (GSF). We have shown the 1st Quartile, Median and 3rd Quartile points for reference. Without applying any filters our building’s security costs are in the second quartile — but fairly close to the first quartile range.
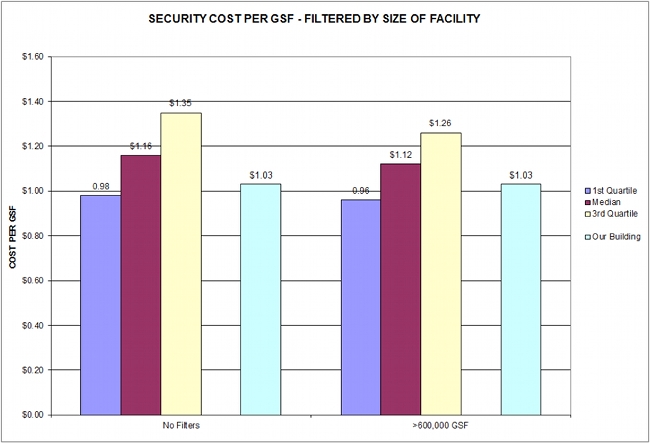
If we filter this sample by size of the facility, our relative performance gets a little worse: we move up the chart just a little bit to near the near the middle of the 2nd quartile range (median). Clearly the size of the facility, at least in the 600,000 GSF area and above, is a factor in comparing benchmarked security costs, but it may not be the most significant factor. We will need to look at some other filters to see if there is a better peer group.
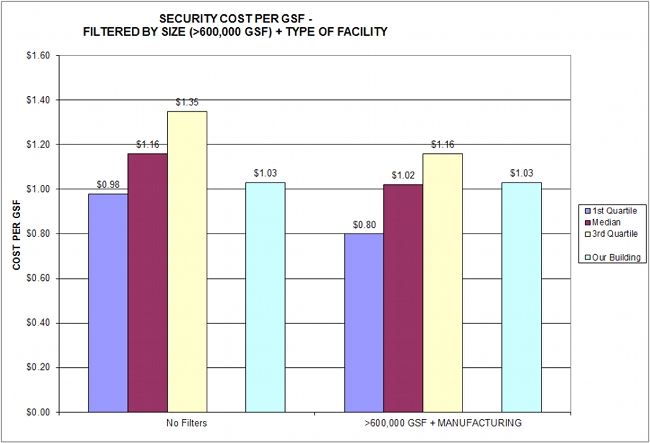
Let’s take a look at the type of facility (manufacturing facility in this case) and see if this has a significant impact on our benchmarked costs. In Figure 2 below, the cost of our security is still $1.03 per gross square foot (GSF); it won’t change no matter what peer group we compare ourselves to. Again, we have shown the 1st Quartile, Median (2nd Quartile) and 3rd Quartile points for reference. Our building’s security costs are now above the median and in the 3rd quartile based on this filter set. Because there was significant “movement” in the results when compared to other facilities, we can feel confident that this combination of filters is starting to feel more like the right peer group: manufacturing facilities greater than 600,000 GSF. This finding indicates that we should be looking at best practices that would improve our performance.
Perhaps the security clearance requirements will have a more significant effect on our security costs. Since this is a manufacturing facility that requires a security background check for all employees and contractors entering the facility we will compare our costs only with those sites requiring the same level of clearance. In Figure 3 below, we compare our costs to our peer group: >600,000 GSF, Manufacturing, and Security Clearance – Yes. This doesn’t change our reference points very much our site is still in the mid-range of the 3rd quartile so security clearance background checks don’t have much of an impact on security group costs (or they may be masked by the strengths of the other filters we applied).

So, in developing this comparison we have learned that our peers are generally providing a lower cost of service and we need to begin looking for best practices to reduce our costs. What is really happening here is that the FM is realizing that looking at facilities without good peer group comparisons is a real waste of time. You need tools to iterate your way to the appropriate peer group for your specific situations. General numbers may be a good starting point, but to really make informed decisions, a more detailed breakdown by criteria that affect operating costs is necessary. That is the only way one can compare the benchmarked facility to one that is best-in-class.
We define that “breakdown” as using a set of filters. Each of the below items becomes a filter:
- Industry type
- Age of the facility
- Climate type
- Security clearance
- Hours of operation
- Days of operation
- Union or non-union labor
- Number of employees
- Facility condition index
In actuality, there are nearly 40-50 potentially useful filters for looking at security metrics, and more that are germane to other operating costs, such as utilities, maintenance, and janitorial.
Benchmarking of operating costs is popular among FMs, as these are what the FM can both measure and control. More than 95 percent of operational expenses are incurred by:
- Utilities
- Maintenance
- Janitorial
- Security
Many FMs don’t go any further with the benchmarking process but nothing we’ve done so far will help improve your performance. All we’ve done is find out how we’re doing compared to our peer group (filter set). In next month’s article we will show you how these filter sets can be used to identify the best practices you could implement to improve your performance over time.