August 2016 — Utility costs, or the question of how to reduce them, are usually near the top of FMs’ priorities. The reason is clear—when you look at overall controllable spending, utility costs are almost always the largest single expense in the operating budget. The percentage varies, but a good average for benchmarked facilities is about 35% plus-or-minus 5%. If you are focused on reducing your energy costs you are on target.
So how can benchmarking be used to help reduce utility expenses? First, you need to know where you stand with a good peer group. Benchmarking utility costs is probably one of the easiest components to input. Using a form provided by FM BENCHMARKING (see Figure 1), there are many data fields, but most participants use only a few of them:
- Electricity consumed for building use
- Natural gas
- Water
Most other fields usually remain blank unless you use alternate fuels or are on a district heating or cooling loop.
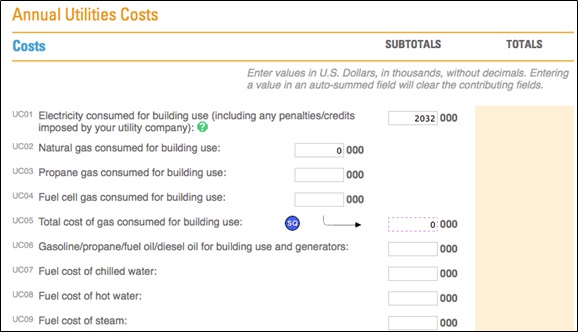
Provided courtesy of FM BENCHMARKING
From the type of data in Figure 1, any benchmarking system should be able to provide a normalized cost comparison of your utilities costs. This kind of benchmarking system shows where you stand compare to your peers as shown in Figure 2, which is filtered to include : all office buildings greater than 600,000 sq. ft.
Note that our building is in the low-cost end of the second quartile with a utilities cost of $1.88 per square foot. There is some room for improvement and it’s probably going to take the implementation of some key best practices to move into the first quartile.

Provided courtesy of FM BENCHMARKING
A facility manager looking at this chart should be asking the question, “What do I need to do to move into the first quartile?”
A good benchmarking tool will provide you with the information to answer that question. In Figure 3 are the first five best practices from the FM BENCHMARKING application. Note, question UB05 is new so there is not yet sufficient data in the system.

Provided courtesy of FM BENCHMARKING
To reduce your energy consumption you need to know what to change in your facility. Asking employees to turn off the lights isn’t very effective so you need other options. One way to do that is to compare what others are doing. Note, that most of the best practices list and implemented by the participants in our quartile and the next better quartile have not been implemented at our facility. FM’s should carefully analyze which best practices would have the highest return on investment and the highest benefit reducing utility costs. By applying these, you are sure to improve your performance. For a little bit of your time you will receive quite a bit of valuable feedback on which best practices would have the most benefit to improving your performance.