August 2020 — Even in the COVID-19 era, outsource providers have benchmarking needs that can benefit from benchmarking.
Benefits from benchmarking
Contractors’ requirements are still in place, so here are the most common reasons for benchmarking:
- Use benchmarking data in developing proposals for new work. At FM BENCHMARKING we regularly receive requests from contractors to help with proposal pricing.
- Benchmark internally, between different portfolio clients, to track costs and understand how their various contacts are performing. This is a low risk approach since you don’t even need to show the client the results if they are unfavorable.
- Use the benchmarking info to identify the best performing sites and identify their best practices that led to those results.
- Contracts often require benchmarking of key performance indicators (KPIs) to assure the owner that the services provided are competitive and consistent with industry costs and levels of services.
- Use benchmarking to avoid the need to rebid work. When a client is receiving good services at a market price it doesn’t make sense to rebid the project just to prove the price is competitive.
Obstacles to benchmarking
Without good benchmarking comparisons, outsourcers may not realize their cost profile is high or low. So, what holds organizations back from benchmarking? Here are the common reasons we’ve heard:
- The data are unavailable or may be held by different organizations.
- Information regarding space or headcounts is held by the client (just another version of item 1).
- Many benchmarking forms are not user friendly, so it can take a lot of time to input.
- It can take a long time to collect the data (even though there is not much data to collect for basic benchmarking, which will yield much of its potential benefit).
The above issues can be easily overcome and the benefits to benchmarking certainly outweigh the negatives.
Examples: Benchmarking for energy consumption
Here is a suggested approach to help you to get started. We have used examples related to energy consumption to illustrate how easy the process should be. This approach will allow you obtain the key output reports in the minimum amount of time. Subsequent articles will cover maintenance and janitorial benchmarks.
Energy utilization is benchmarked on a gross area basis. Since, for most buildings, the electricity usage is the major component we usually look at electric energy intensity: KWH/Gross Area.
It is also important to compare usage among similar types of buildings. Since our building is an office facility, we will filter the data to include only those types of facilities.
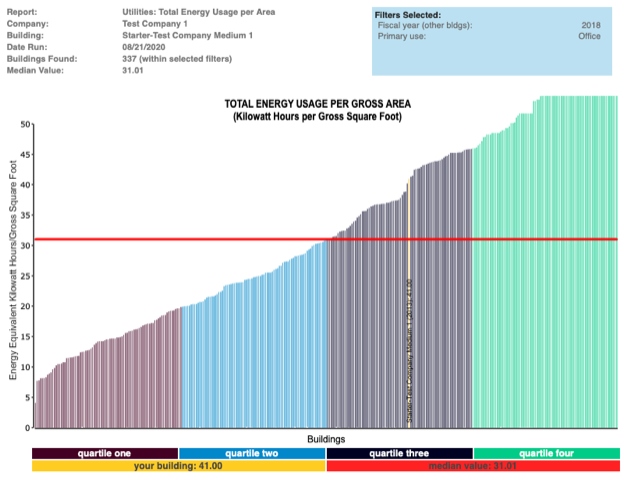
Figure 1 – KWH usage per GSF
Filters: Type of facility (Office)
Provided courtesy of FM BENCHMARKING
Figure 1 allows you to see, at a glance, how well the facility is utilizing electricity compared to other office buildings. There are 337 buildings in this office building peer group, with a median KWH utilization of 31.01 KWH/GSF and a first quartile performance of 19.83 KWH/GSF. Our facility (shown in light yellow) is in the middle of the third quartile at 41.00 KWH/GSF which is not a good performance.
Let’s consider some additional filters to see if we can improve the appropriateness of the peer group. Let’s consider that the size of the facility will have an impact. To see what that peer group looks like we will filter for only the buildings in our size range. Our building is 220,000 GSF so we will filter for buildings between 125,000 to 249,999 GSF.
As you can see in Figure 2 below, there is no significant change in our standing with this peer group. We are still in the middle of the third quartile, so we’ll remove that filter.
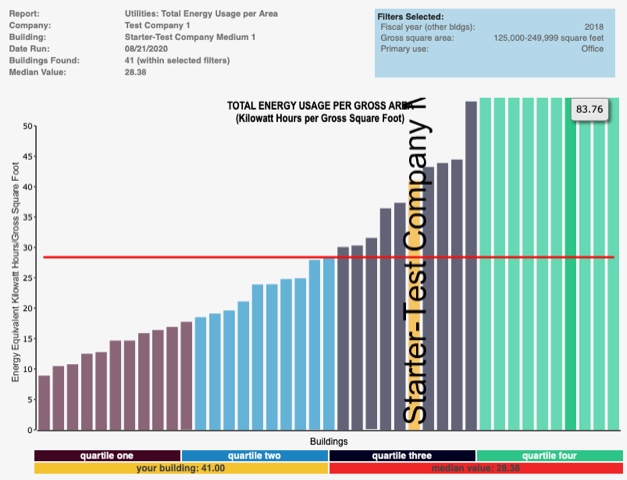
Figure 2 – KWH usage per GSF
Filters: Type of facility (Office), Size: 125,000 to 249,999 GSF
Provided courtesy of FM BENCHMARKING
As our office building is in a hot-dry climate, we think that the climate zone of our facility may have a significant impact on the energy consumption, so we will turn on that filter. This will remove buildings from other climates from our comparison, and since those other buildings are expected to consume less energy than our building, our building should “shift” to the left, even though its energy consumption remains the same.
As you can see in Figure 3, this has a significant impact on our peer group standing, as our building’s performance is now in the middle range of the second quartile.

Figure 3 – KWH usage per GSF
Filters: Type of facility (Office), Climate Zone: Hot-Dry
Provided courtesy of FM BENCHMARKING
This benchmarking approach validates the value of good peer group to make informed decisions about the performance of the facility. The next task will be to identify the best practices that would further improve the performance. That will be covered in next month’s article, by identifying the best practices being employed by the buildings to the “left” of our building.