February 2020 — In last month’s article, we demonstrated how benchmarking can be used to present your building’s energy performance relative to a good peer group. In this article we will show how you can take that information to identify possible utility best practices that would improve your building’s performance. By benchmarking the building performance and applying specific filters, you will see which energy best practices have the most impact.
Building Background: Our building example is a 220,000 GSF (gross square feet) office facility located in a “hot-dry” climate zone. The total occupancy is 500 FTE employees and it operates with 16 shifts per week.
In Figure 1, we see that the energy consumption for our example building is 41 KWH per GSF and the median value is 30.77 KWH per GSF. Our building’s consumption is shown in yellow and is near the middle of the third quartile. Our initial thought is that this performance is poor but perhaps an additional filter should be applied before reaching that conclusion.
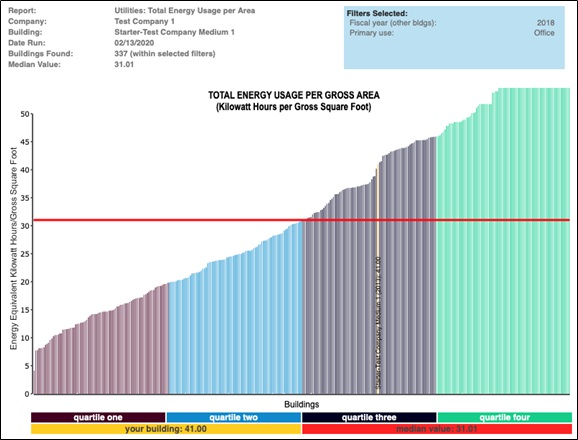
Figure 1 – Total energy usage per GSF
Filters: Type of facility (Office)
Provided courtesy of FM BENCHMARKING
Let’s consider buildings that operate with similar shifts (16) to see if this would be a better peer group (see Figure 2).
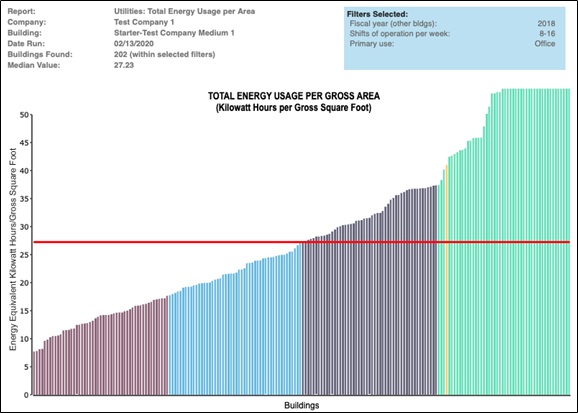
Figure 2 – Total energy usage per GSF
Filters: Type of facility (Office) + 8-16 shifts per week
Provided courtesy of FM BENCHMARKING
This set of filters makes our relative performance look even worse. It would appear that facilities managers, who operate facilities over extended hours, have implemented better energy saving measures.
Let’s add one more filter, climate zone, and see if this would be a better peer group. As you can see in the Figure 3, our performance is still in the third quartile and all of the various filter options point to an opportunity to improve or reduce the energy consumption of this facility. This is where benchmarking of best practices can lead us to make good decisions on which programs would have the most impact.

Figure 3 – Total energy usage per GSF
Filters: Type of facility (Office) + 8-16 shifts per week + Hot-Dry climate zone
Provided courtesy of FM BENCHMARKING
There are 44 best practices in the FM BENCHMARKING tool, and we will look at a few of them to consider where the best opportunities exist. In Figure 4 below we have shown a few best practices. This shows the percent of “Utility Best Practices” based on the filter set, implemented by the peers in our building’s quartile (3) compared to the percent implemented by the next better quartile (2). In other words, looking at the first line of the table:
- We are not using motion sensors in our conference rooms.
- 76% of the others in our 3rd quartile are using motion sensors there.
- 86% of those in the next better 2nd quartile are using motion sensors there.

Figure 4– Energy Best Practices Based on Cost per Area
Filters: Type of facility (Office) + 8-16 shifts per week + Hot-Dry climate zone
Provided courtesy of FM BENCHMARKING
Well, all of the items show significant percentage changes from Q3 to Q2 but they can’t all be equally important. For example, you’ll never see much of a change in energy consumption by putting motion sensors in the restroom vs. the office space. Still, maybe that helps raise employee awareness that energy savings are important. But clearly, on this list, many items would have a much more significant impact.
- UB02: Motion Sensors in General Office Space
- UB04: Initial Commissioning
- UB15: Daylight sensing to turn off lighting when not needed
- UB16: Mechanically operated window coverings controlled by daylight sensors
There are many more best practices, 44 in the utility section alone, but these examples show the power of benchmarking in making data driven decisions. Additionally, you can be reassured that the proposed work will successfully pay off since it has worked successfully for the peer group in the second quartile.