February 2019 — The key to good benchmarking is using the correct comparisons. FMs participate in benchmarking programs only to find that they have difficulty developing good comparisons for their facility type. But if you have adequate data and good filter sets you will get the right comparisons. Here are a few examples to show the value that filters can add to the analysis of your benchmarking data.
For example, if you are comparing your facility’s janitorial costs you might not know which filters are the most relevant. Here are some examples to illustrate what makes a difference. We are using data from the online benchmarking tool, FM BENCHMARKING.
The first filter we should use is the type of facility. There are many types of facilities in a benchmarking database, such as health care, manufacturing, office, hospitality, and cultural to name just a few. Let us say our subject facility is an office facility and comparisons with other office facilities would therefore be sensible.
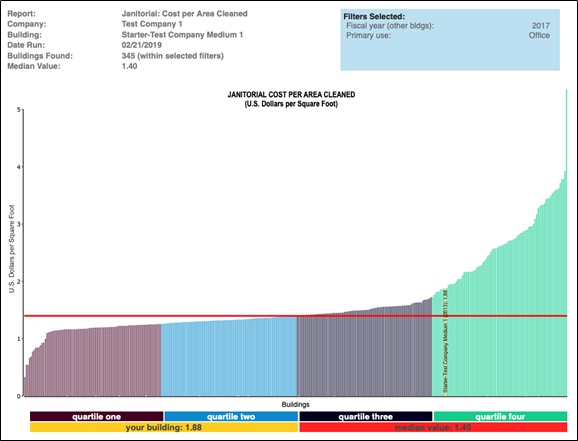
Figure 1 – Janitorial Cost per Area Cleaned
Filters: Type of facility: Office
Provided courtesy of FM BENCHMARKING
Figure 1 allows you to see at a glance how well your facility is doing regarding spending on janitorial costs. There are 345 buildings in this peer group with a median cost of $1.40 per cleanable square foot with a sample size of 345 buildings. Our facility is shown in yellow with a janitorial cost of $1.88 per cleanable SF and near the lower end of the fourth quartile. Note that we use “cleanable sq. ft.,” which is not the same as either “gross sq. ft.” or “net sq. ft.” or “rentable sq. ft.”
Next, let’s look at the size of the facility to see if it has any impact on janitorial costs. Our facility is fairly large at 220,000 GSF so that may impact our benchmarking comparisons. We will turn on the size filter with a size range of 125,000 to 249,999 GSF and also the office filter.
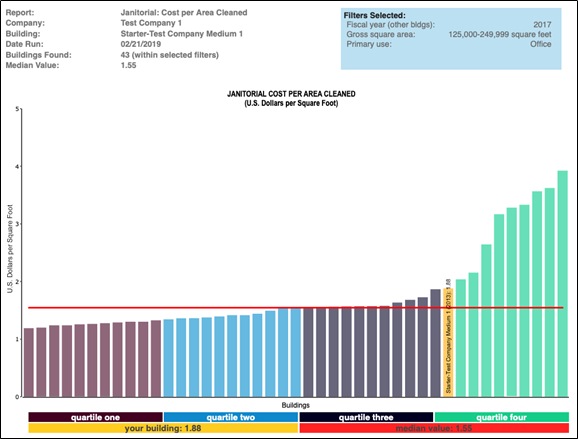
Figure 2 – Janitorial Cost per Area Cleaned
Filters: Type of facility: Office + facility size 125,000 – 249,999 GSF
Provided courtesy of FM BENCHMARKING
With this peer group, we see in Figure 2 that the median cost per cleanable square foot increased from $1.40 to $1.55 per cleanable square foot. This has the effect of “moving” our facility to beginning of the fourth quartile. Because of this movement, we conclude that medium-sized buildings do have an impact of the janitorial costs, so we will leave this additional filter in place.
Next, let’s consider the amount of time the facility is occupied. We will do this by using a filter for shifts per week and leave the other previous filters turned on. Our facility operates 16 shifts per week so we will use the filter 8-16 shifts per week.
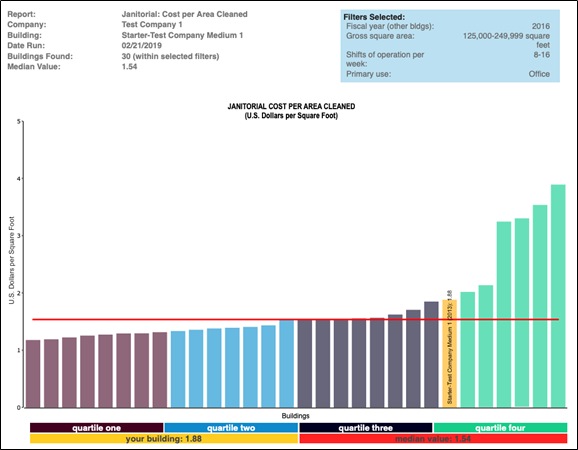
Figure 3 – Janitorial Cost per Area Cleaned
Filters: Type of facility: Office + facility size 125,000 – 249,999 GSF + shifts 8-16 per week
Provided courtesy of FM BENCHMARKING
With this peer group, we see in Figure 3 that the median cost per cleanable square foot changes insignificantly from $1.55 to $1.54 per cleanable square foot. Our building’s position on the chart is unchanged. So we may want to turn this filter off and use a different filter instead, or just go with the filters we have.
Our costs are in the fourth quartile and both the level of service and the contract for janitorial services should be reviewed.