September 2019 — In last month’s article we reviewed benchmarking maintenance staffing. This month’s article will review how you can benchmark janitorial staffing for either your internal staff or contractors. Since janitorial costs are primarily comprised of labor, having the right staffing level is the key to an appropriately clean facility as well as keeping costs down.
Almost every organization goes through a contract rebid for janitorial services or an analysis of the current costs of providing janitorial services. Often the specification will require the janitorial contractor to provide a staffing plan. Since labor comprises between 85% and 90% of janitorial costs, the vendor with the lowest proposed staffing levels usually has the lowest costs. But the lowest staffing level proposal may not be appropriate for the cleaning of your facilities. You can use the same benchmarking data to determine if the existing contractor is adequately staffing for the cleaning services required.
Most benchmarking surveys will collect their staffing benchmarks on a full-time equivalent (FTE) annual basis. Depending upon the level of detail, that could ask for:
- Total staff
- Staffing broken down by internal and contract workers
It is our experience that most organizational staffing level questions come down to total staffing levels. In the case of janitorial services, nearly all the cleaning will be provided by the contractor so in most cases total staff and staffing by contract workers will be the same value. One aspect that you need to look at carefully is how the FTE count is calculated. Many contractors will use part time help and you may have, for example, 10 people in a building for 2 hours each day for 5 days per week. The FTE in this example would be calculated at (10 X 2 X 5)/40 = 2.5 FTE
Determining and keeping the appropriate janitorial staffing levels is probably one of the more critical decisions that facility managers and the senior leadership team can make. Janitorial contractors informally say, “we will propose to staff the job at whatever level is needed to obtain the bid, then reduce the staff as needed to provide a profit.” The only way to assure the contractor is living up to their bid is by validating the number of workers on the job.
An example (Figure 1) illustrates how easy and valuable the process should be and how you can avoid the problem of too much or too little staff. This approach allows you obtain the key output report of staff per cleanable area. Note that in benchmarking janitorial costs, it is critical to use cleanable area as opposed to gross or net rentable area; usually cleanable area is stated in the cleaning contract documents.
Figure 1 shows the staffing level performance compared to that in other similar office buildings. We will ignore a few of the extreme responses at both ends of the chart and say the overall performance ranges from about 35,000 SF to 9,000 SF cleaned per person. About half the group is in the second and third quartiles between approximately 21,000 and 18,000 SF cleaned per person. This is the appropriate staffing range to assure the facility is adequately cleaned.
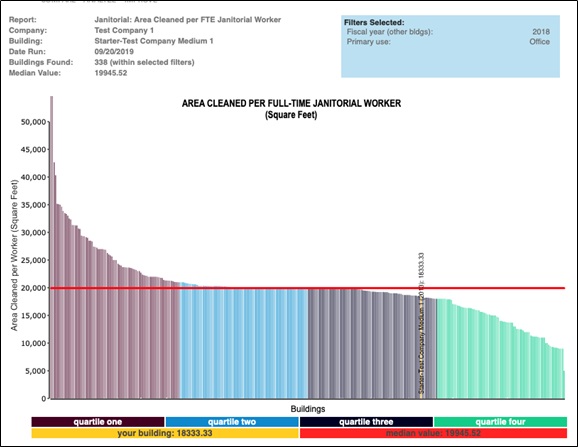
Figure 1 – Area Cleaned per Person
Filter: Type of facility: office
Provided courtesy of FM BENCHMARKING
Our building is shown in yellow in the third quartile with a value of 18,333 SF cleaned per worker. This would suggest the staffing level is a bit higher than needed, but let’s look a little further and add an additional filter for the size of the facility.
Figure 2 shows only office facilities in our size range and our relative position in the filtered group is about the same, indicating that in our comparison analysis, the building size doesn’t plan much of a role (it may have played more of a role if our building were very small or very large). In our analysis, we could try other filters to see if they have more of an impact on the benchmarking results.
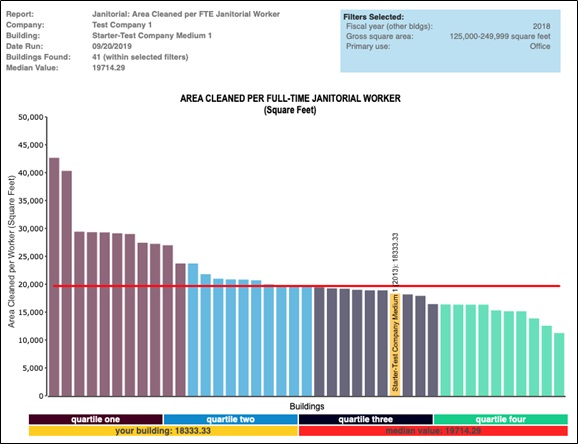
Figure 2 – Area Cleaned per Person
Filters: Type of facility: office; Size: 125,00 – 249,999 square feet
Provided courtesy of FM BENCHMARKING
With these two charts it would make sense to have a discussion with our janitorial contractor and validate that the actual staffing level is consistent with what has been reported.