November 2020 — In these difficult COVID times, securing exterior entries and limited access spaces is a difficult task for many FMs. Thieves, vandals, disgruntled employees, ex-employees, and others can gain access to many facilities simply by walking through unlocked side doors, shipping areas or tailgating an employee. After gaining access to the facility, intruders can roam most of the facility looking for opportunities. The key to effective security is by controlling access.
In 2021 you can expect more employees to access the facility which will create more needs for rebadging, and additional security staff to control access. This will put cost pressures on security budgets. FMs will experience pressure to find better ways to provide improved, cost effective security services that are oriented towards providing a safe workplace.
It often seems that only poor and poorer choices are available when security budgets need to be controlled or reduced:
- Rebid the contract to try and obtain better pricing.
- Reduce staffing levels by closing manned access points, forcing staff to enter the building at less convenient locations.
- Utilize card-readers at unmanned locations, which result in less control and tailgating by employees, visitors, or thieves.
- Install more cameras, which are not really a security enhancement technique since cameras only provide information after the fact.
There should be a better way than just cutting and reducing the service levels and impacting the employee experience. Security benchmarking can help you understand how your costs compare with others in your peer group and may be able to help you justify additional budget funds. Most FMs are familiar with benchmarking concepts. You enter your cost data, occupancy, and areas. From these data, a good benchmarking system should be able to provide a normalized cost comparison for security services. This kind of benchmarking system shows where you stand compared to your peers.
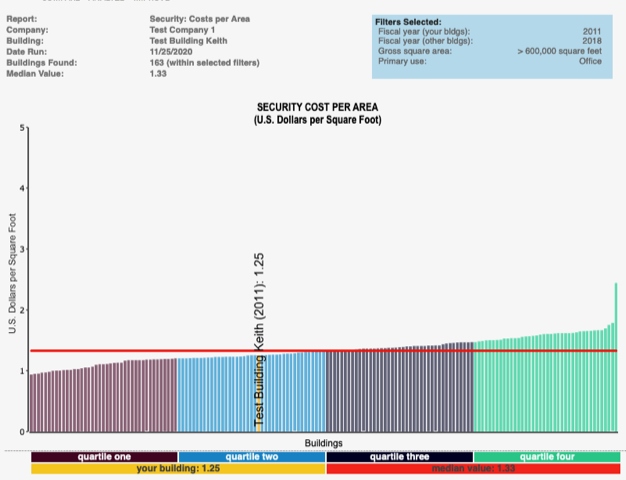
The chart shown in Figure 1 below shows how much the security services cost on a normalized basis compared with other office facilities that are larger than 600,000 GSF. There are 163 buildings in this peer group with a median security cost per gross square foot of $1.33 and a first quartile performance of 1.20 per gross square foot. Our security cost is in the middle of the second quartile, shown in yellow, with a cost of $1.25 per gross square foot.

Filters: Greater than 600,000 GSF + Office Facilities
A facility manager or security manager looking at this chart would probably ask the question, “What do I do to get better, reduce costs, and improve the overall security levels in and around my facility. If I could get the costs to the first quartile performance, I would save about $0.05 per square foot. On my 1,325,000 square foot facility that would be a savings of $66,000.
The chart shown in Figure 2 below, shows the area secured by security worker compared with other office facilities. There are 162 buildings in this peer group with a median area secured of 14,159 gross SF/security worker and a first quartile performance of 15,769 gross SF/security worker.
Filters: Office Facilities
The chart shows that we are in the first quartile on the number of security workers which is unexpected. Basically, we are already very tight on staffing levels (staff are covering more area than expected, given that their costs per square foot are higher). Usually staffing and costs line up fairly closely since labor is a very high component of security costs.
We don’t need to look any further than these two charts to know where the problem is—discussion needs to begin with our current security provider for them to lower their markups and costs, or for us to rebid the work to other firms to obtain better pricing.
In other words, benchmarking can be used here to prove to our contractor that they need to lower their costs or we find another contractor with costs that are lower.