Can you easily show your security performance trends? Did you know that data entered in a benchmarking system can be used to document your improvements or even changes in service levels. Benchmarking is a really straightforward process that can be used to show the value of the FM position in the organization. Without good benchmarking comparisons you may not realize that security costs can be reduced, which security services others are using, or which best practices may have the most impact on improving your security operations. As you can see, a case easily can be made for benchmarking that will justify the minor amount of staff time.
Below, we have used examples from FM BENCHMARKING to illustrate how easy the process should be. This approach will allow you to obtain the key output reports in the minimum amount of time. In the following example, we benchmarked security performance and noted which “best practices” had been implemented in 2010. Then the benchmarking results can be used to show areas for improvement that can be used to justify additional projects to improve the performance of the client’s portfolio.
For the security metrics that need to be benchmarked, focus on the KPI (Key Performance Indicators):
- Security Cost per Gross Area
- Security Best Practices
The process is really straightforward. We will:
- Look at our benchmarked security costs for FY 2010.
- Review which best practices we had already implemented and which other ones could be implemented in 2011.
- Determine which of those best practices were most feasible to implement in 2011.
- Implement the recommended best practices in 2011.
- Review the 2011 benchmarked costs to see how the implemented best practices affected our performance.
Figure 1 shows our security performance compared with our peer group of other office facilities. This allows us to see at a glance how our facility compares with other office buildings. There are 169 buildings in this peer group with a median security cost of $1.19 per square foot. Our building cost performance (see the yellow line) is in the fourth quartile with a security cost of $1.33 per gross square foot. Thus, performance (from a cost perspective) is not good so there is ample room for improvement. By looking benchmarking data in this way and comparing similar types of facilities, you will be able to make intelligent “data driven” decisions.

Filters: Type of facility (Office); Size (Large: >600,000 sq. ft.
Let’s look at the best practices we have implemented and see what others have implemented so we can generate some ideas to improve our security cost performance. We will use the cost performance data to see what others in our quartile and the next better performing quartile have done.
Figure 2 is a partial listing of the best practices implemented by those participants in our quartile and the next better performing quartile. There are actually about 20 best practices in the full table. After looking at just the first few we should consider recommending:
- BPS3 — Certification of more than 80% of the guard force.
This shows a 15% jump in the implementation rate between the 4th and 3rd quartiles. Guard force certification is an effective measure of the quality of the staff performing the security services. - BPS8 — Security and reception of visitor services are fully coordinated and combined.
This shows an 18% jump in the implementation rate between the 4th and 3rd quartiles. It seems obvious, but there are considerable cost savings, and negligible drawbacks, in coordinating these two functions.
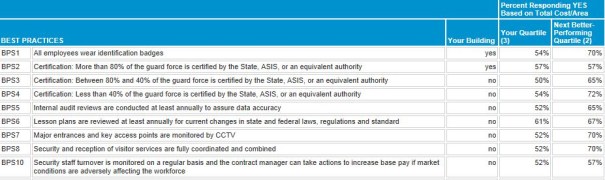
Filters: Type of facility (Office); Size (Large: >600,000 sq. ft.
So by looking at the more than 20 best practices we can easily develop a program of top priority items that will reduce our security costs and improve the security quality. This gives us an excellent idea of the types of programs to implement in fiscal year 2011.
In this example, of an actual facility located in Florida, USA, “Management” approved the funding and organizational changes for our recommendations. The programs and changes were implemented and we benchmarked our performance again one year later in early 2012 for the calendar year ending 2011.
Figure 3 compares our security performance to other office facilities in the same manner as Figure 1 except that this is for 2011 instead of 2010. Note that we are now in the 2nd quartile and our security costs have declined to $1.18 per GSF. This is a reduction of $0.18 per GSF over the entire building—quite an improvement! There are 167 buildings in this peer group with a median security cost of $1.19 per GSF so this is a very similar peer group compared to our 2010 benchmark.
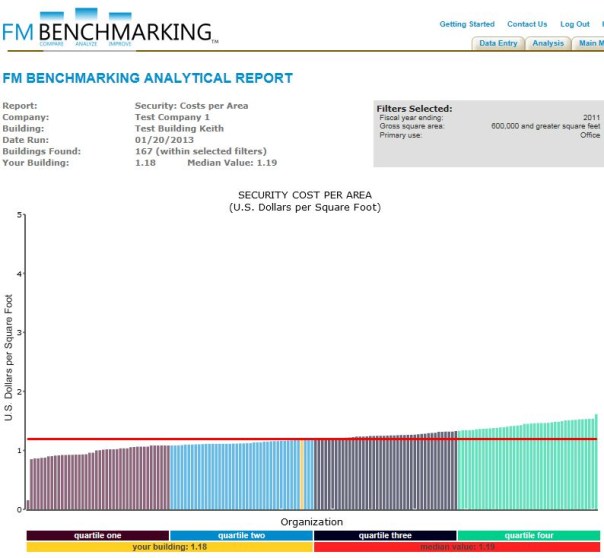
Filters: Type of facility (Office); Size (Large: >600,000 sq. ft.
Not only can we show significant improvement, but we have documented our initiatives in the “security best practices” (see Figure 4). Note that in 2011 we have implemented:
- BPS3 — Certification of more than 80% of the guard force.
- BPS8 — Security and reception of visitor services are fully coordinated and combined.
Again the benchmarking data supports our decision to implement these best practices and the implementation rates are even higher for the 2nd quartile. This means a higher percentage of our peer group has also implemented this best practice. We are in good company with steadily improving performance.
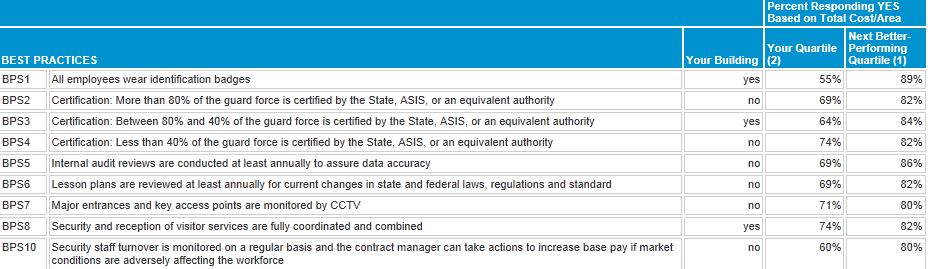
Filters: Type of facility (Office); Size (Large: >600,000 sq. ft.
Conclusions
Using the results from benchmarking, the FM can make proven recommendations that will reduce security costs and improve security performance. The company achieved:
- Security cost savings by implementing the best practice recommendations.
- A higher quality and better performing security workforce.
- Improved levels of service or no degradation of service.