June 2019 — Security costs continue to rise, usually faster than the rate of inflation. There are logical reasons for the increasing costs:
- The majority of security costs are labor
- Security workers are near the low end of the wage scale
- An increase in the minimum wage tends to impact the wage rates of security workers.
Security costs are usually not the highest component of facility costs; they are usually similar to the cost of janitorial services in the facility budget portfolio. Still, many FMs are continuously looking for options that would improve the efficiency of their facilities and ways to reduce costs without impacting services.
The first step in the process should be a good understanding of the cost structure for security services. Knowing if your normalized costs are high, in the mid-range, or low can help identify the magnitude of the issue. The logical approach would be to apply benchmarking with filters to understand the relative position of the organization with a good peer group to analyze.
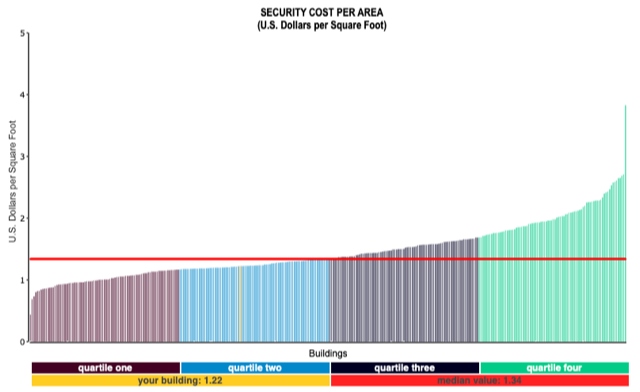
Figure 1 – Security Cost per GSF
Filters: Type of facility: office
Provided courtesy of FM BENCHMARKING
In Figure 1, we compared the security cost per square foot for 339 office buildings in the benchmarking data set. Since our building is an office facility, we want to compare only other office buildings. By analyzing the data through this filter, our facility, compared with our peer group, is in the mid-range of the second quartile (look for the thin yellow line just left of the center of the blue quartile—that represents our building).
The size of our facility may affect our peer group. Since our building is 220,000 GSF we will compare it to other office buildings in the same size range of 125,000 to 250,000 GSF (gross square feet). Figure 2 below shows a minimal change in our peer group position, but it did push our building a bit to the right—this makes sense, as a relatively small building will cost more to secure per square foot than a large building (notice that the median—shown by the red line—is a bit lower in Figure 2 than in Figure 1).

Figure 2 – Security Cost per GSF
Filters: Type of facility: office; Size 125,000 – 250,000 GSF
Provided courtesy of FM BENCHMARKING
There are 16 “Security Best Practices” in the FM BENCHMARKING application, which is the tool we used for this analysis. In this tool, benchmarking participants indicate if they have completed a best practice in more than 50% of their facility by selecting “Yes”. The results are tabulated by quartile and compared with the next better performing quartile. Our facility is in the second quartile so it will be compared with those facilities in both quartile one and two.
In Figure 3, we will discuss the first four security best practices (there are many more in the FM BENCHMARKING tool):

Figure 3 – Security Best Practices
Filters: Type of facility: office; Size 125,000 – 250,000 GSF
Provided courtesy of FM BENCHMARKING
The first best practice addresses employee identification badges. We are already doing that and are seeing a positive result from our standing in the mid-second quartile.
The next three best practices address security force certification. Our workforce is between 40% and 80% certified. We should consider obtaining certification for more of our employees since the best practice SB02 shows 91% of 1st quartile performers are in this category. Generally, when there is a significant difference between the implementation rates in the two right columns, these indicate a best practice worth considering.