March 2016 — Benchmarking does not have to be difficult, but too many FMs look at the process and push it back to “another day.” Here is a suggested approach to help you to get started. We have used examples to illustrate how easy the process should be. This approach will allow you obtain the key output reports in the minimum amount of time.
First of all, focus on what is important! I just finished a meeting with the CEO and CFO of a major Fortune 500 company and they were overly concerned about the cost of the landscaping. It seems that the landscape crew felt a need to keep the areas that the C-suite can view in perfect condition and they thought that all the property was therefore landscaped to the same high level. I assured them that it wasn’t and that, even if it were, cutting the landscape budget by half would not have a significant impact on the operating expense for the facility.
So what is important then? If you’re just starting with benchmarking, you should start first with space utilization. If you cut 10-20% from the operating budgets in utilities, maintenance, janitorial, and security and you will save up to 20% of those budgets. But get rid of some space and you will save 100% of the operating costs for that space. That is why we want to be sure all the space an organization has is still needed. We also can say that most organizations have both owned and leased space. Get the space standards right and they can shed the leased space. FMs also know that hardly any organization will “volunteer” to give up space. That is why you have to show good benchmarking comparisons and gather support for eliminating space. The usual reaction is, “We can’t cut it any further without making our employees unproductive.” The reality is, you really don’t know if you can reduce space unless you can compare to some similar buildings and see how they are doing with their space utilization.
When comparing space utilization it would be really great to know how other facilities are managing their space. Maybe some are operating just fine on less space, or maybe what is being requested of you will result in a space utilization that’s higher than anyone else. Let’s start with the Key Performance Indicators (KPIs) for space utilization. The usual KPIs for space utilization are:
- Gross area per occupant
- Rentable area per occupant
These KPIs will show how your space utilization compares with others. But comparing your space utilization with everyone else may give you the wrong perspective on your performance unless the comparisons are made with a relevant peer group.
Figure 1 shows the above KPIs listed based on your criteria comparing office facilities. There are only a few facilities at the extremely low and high ends of the chart. This suggests our data is valid. About 95% of the organizations providing data understood the definitions and measured their space in a manner consistent with the definition.
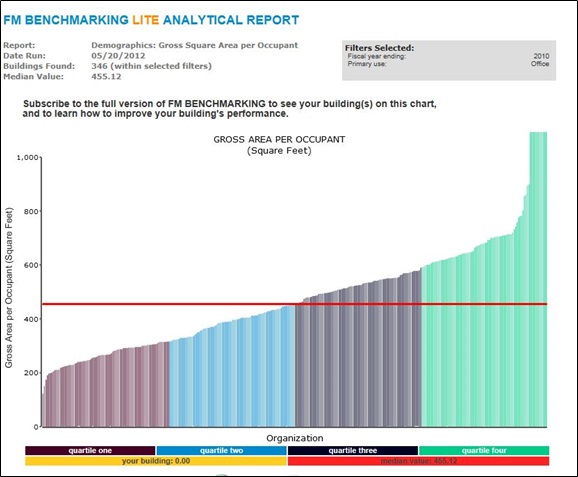
Figure 1 – GROSS AREA PER OCCUPANT.
Filters: Office buildings
Provided courtesy of FM BENCHMARKING
This chart allows you to see at a glance how well your facility is performing its space utilization. There are 346 buildings in this peer group with a median space utilization of 455 per GSF per person and a first quartile performance of about 315 GSF per person. Let’s assume you have 1000 employees in your facilities and they are utilizing space at the median level. But you think you could get them to first quartile performance by subleasing or closing some of your facilities. That would result in a space reduction of about 140,000 GSF. Assume your operating costs are at the median level (about $6.50/GSF); the result would be a net annual savings of about $910,000. By looking at and comparing similar types of facilities, you will be able to make intelligent “data driven” decisions.
One other factor to consider would be the building size. Larger buildings are usually not as efficient as smaller buildings since the larger buildings have more penetrations for elevators, stairs, mechanical systems, etc. Most of the subject company’s buildings are about 200,000 GSF each so let’s turn on a filter for the facility size.
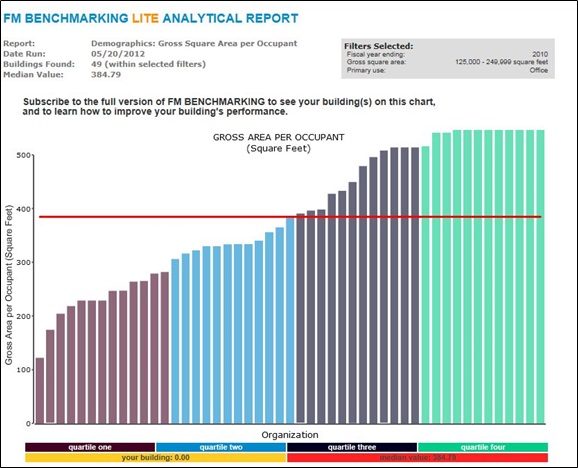
Figure 2 – GROSS AREA PER OCCUPANT
Filters: Size of facility: 125,000 – 249,000 GSF; Site Type: Office buildings
Provided courtesy of FM BENCHMARKING
Figure 2 allows you to see at a glance how the facility size affects space utilization. There are 49 buildings in this peer group with a median space utilization of 385 per GSF per person and a first quartile performance of 306 GSF per person. Our performance of 455 GSF per person is in the 3rd quartile with this peer group—thus, an even more compelling reason to improve our space utilization.
Using this type of benchmarking tool can enable you to see how your building compares to other similar ones in a very quick and easy manner. If your facility performance is in the third or fourth quartile you may need to investigate and benchmark further to determine the next steps to take.