Space utilization is one of the easiest services Facility Managers can benchmark. What makes it so easy is that, for most FM’s, the data is probably at your fingertips. You need to know how many people are occupying your facilities and how much area they are in.
Step 1 – Determine your facility area and your occupancy headcount.
Now there are a lot of ways to calculate space utilization gross, net, rentable, usable, assignable, etc but it is best to start benchmarking with a simple definition that works for everyone involved. We always start with gross square feet. What is gross square feet? The total square feet under roof of building areas as measured to the outside of walls. Include enclosed storage, equipment buildings, and all occupied areas. Do not include covered walkways, covered exterior docks, equipment pads, interstitial space, utility, tunnels, and support equipment mezzanines. Square feet in all cases should be based on an as-built basis as opposed to forecasted configurations.
What headcount should you use? You should use the total site population from all shifts. Total number of employees includes permanent employees and temporary personnel such as consultants, contract employees, customers, tenants, and auditors who occupy space at the site. Occupancy is a critical value in normalizing your data. It is easy to overlook or under estimate the number of contractors, transient occupants, and temporary employees that are located in your facilities throughout the year. Meet with your Human Resources or Staffing personnel to help determine the number of site occupants for the reported year.
Step 2 – How Do I Compare With Others…
Once this information is collected it is easy to determine how effectively space is being utilized at a particular site. One of the summary charts in a benchmarking report on space utilization would look like this
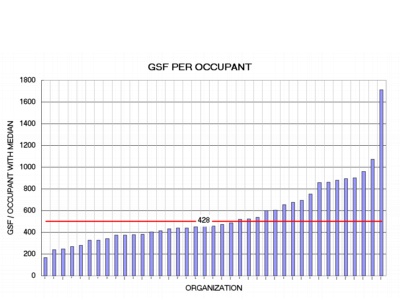
Each bar on the chart represents a site space utilization of gross square feet per person. Of noteworthy interest is how consistent the space utilization is for the group. More than half of the participants would fall between 350 gsf and 750 gsf per person.
Step 3 – Using This Information…
Let’s assume you’ve completed your space data collection and performed the calculations. Here are a few questions you should ask yourself
- Where do you stand on these charts? Are you above the median or below it?
- Could you explain to management why your positions on the charts is just right or needs to be changed?
- What are some of the reasons that explain your positions on the charts?
- Is your company expanding or contracting? Perhaps you want a low utilization rate for expansion next year.
- What are your space standards?
- Do you have a chargeback system that encourages users to be prudent with their use of space?