May 2019 — Utility costs continue to rise, usually faster than the rate of inflation. Electricity and gas combined are either the first or second cost component for most FMs and usually electricity is the highest component of the mix. If you are not continually looking at ways to reduce consumption or demand charges, utility costs will very quickly become a disproportionate share of your operations budget. It is such a large component, usually around 35% of operating costs that many FMs are continuously looking for options that would improve the efficiency of their facilities.
In last month’s article we showed how you can use benchmarking, through filters, to determine how your utility costs compare with other similar buildings. We applied the filters shown in Figure 1 below to obtain a good peer group. Access to ample data, with good filter sets, is key to making the right comparisons.
In this example, we determined that the most appropriate filters for us to use to study energy consumption were to compare our buildings to other office buildings that also were in a hot-dry climate. This became known as our peer group. We see that our building (shown in yellow) is in the middle of the second quartile, which is not bad. Nonetheless, our management has asked us to see if it would be feasible to make additional improvements so we could get into the first quartile.

Figure 1 – Utility Consumption per GSF
Filters: Type of facility: office; Climate-type: hot-dry
Provided courtesy of FM BENCHMARKING
All we have done so far was to compare our building’s performance to those of others in our peer group. But making comparisons without implementing changes to improve performance will not help you reduce your utility costs—your building likely will stay the same or become even worse because many of your peers will be trying to reduce their costs. Therefore, it would be good to know what others in the next better performing quartile have done to achieve their results. We will do this by examining the utility best practices we have not yet implemented and see which of them other, better-performing buildings have implemented.
By using the FM BENCHMARKING database, we see there are 44 utility Best Practices that were identified as having the most impact for most buildings; in this database, benchmarking participants indicate if they have completed a best practice in more than 50% of their facility.
In FIgure 2, we see the percentage of others in our peer group in our quartile who have implemented each best practice as well the percentage in the next better performing quartile.
The three best practices shown deal with motion sensor implementation and our building has not implemented any of them. As you can see there is a significant difference in the implementation level between quartile one and quartile two (keep in mind that these results apply only to those with the same filters as we have selected for our building: office buildings and hot-dry climates—changing these filters will change the results).
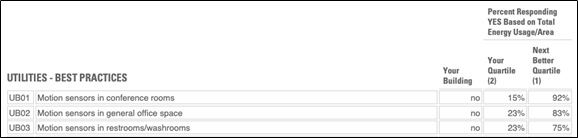
Figure 2 – Utility Consumption based Best Practices
Filters: Type of facility: office, Type of climate: hot-dry
Provided courtesy of FM BENCHMARKING
Generally, when there is a significant difference between the implementation rates between two quartiles, implementing that best practice very much worth considering. Realistically there probably isn’t that much energy consumption in restrooms and conference room so the most significant payback would come from implementation of motion sensors in the office space.
In Figure 3, we look at additional best practices for those in this same peer group. Another often overlooked area is the opportunity to reduce demand charges. For many facilities, demand charges can approach the costs of the usage charges.
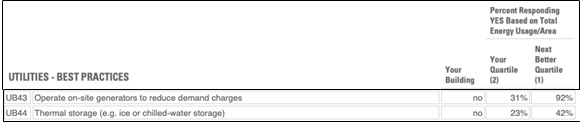
Figure 3 – Utility Consumption based Best Practices
Filters: Type of facility: office, Type of climate: hot-dry
Provided courtesy of FM BENCHMARKING
As you can see in the above table, facilities in the first quartile have implemented a higher rate of demand control strategies than those in the second quartile.
We have found that certain best practices have more of a performance impact when trying to improve from the second quartile, while others tend to be the low-hanging fruit when improving from the third or fourth quartiles.