May 2018 – In the next few articles we will identify best practices would be the most effective in improving building performance. By benchmarking the building performance and applying specific filters that describe your building, you will see which best practices have the most impact. This month we will benchmark utility best practices. In future articles, we will benchmark best practices for other FM applications such as maintenance, janitorial and security.
Other articles in this series include:
Based on Figure 1, the energy consumption for “our building” is 41 KWH per GSF and the median value is 30.77 KWH per GSF. Our building’s cost, shown in yellow, is near the middle of the third quartile. But where to make the improvements? It is obvious that improvements should be made but we need to evaluate the best practices to see which would be the most effective at improving performance.

Figure 1 – Total energy usage per GSF
Filters: Type of facility (Office)
Provided courtesy of FM BENCHMARKING
This is where benchmarking of best practices can lead us to make good decisions on which programs would have the most impact.
Consider Figure 2 below, which identifies four of the utility best practices not being followed in our building. It also shows the percent of Utility Best Practices implemented by the peers in our building’s quartile (3) compared to the percent implemented by the next better quartile (2).
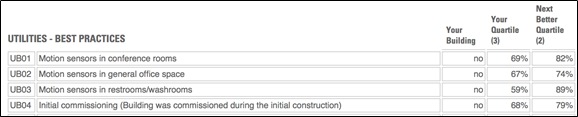
Figure 2 – Energy Best Practices Based on Energy Intensity per Area
Filters: Type of facility (Office)
Provided courtesy of FM BENCHMARKING
Based on the percent of implementation difference it would seem that “UB03 – Motion Sensors in restrooms” would have the greatest impact since it has the greatest differential between 2nd and 3rd quartile performance as well as the highest percentage of FMs. In the 2nd quartile (89%).
But we have applied only two filters to represent our building. Let’s apply some other filters to see if the results change. In Figure 3 below we applied an additional filter of building age “21-50 years” since our building is 38 years old. Note how the implementation rate increases for each of the best practices. UB 03 has an even greater differential of 24% between the 3rd quartile and the 2nd quartile. This would seem to be a good choice but let’s look at one other filter before recommending motion sensors in restrooms.

Figure 3 – Energy Best Practices Based on Cost per Area
Filters: Type of facility (Office), Age (21-50 years)
Provided courtesy of FM BENCHMARKING
Our building operates for 16 shifts per week which may possibly reorder the best practices. In Figure 4 below the best practices are shown and they all show a significant spread between the 3rd and 2nd quartile.

Figure 4– Energy Best Practices Based on Cost per Area
Filters: Type of facility (Office) , Age (21-50 years), Shifts (8-16 per week)
Provided courtesy of FM BENCHMARKING
UB 03 still has the greatest differential of 14% between the 3rd quartile and the 2nd quartile. Clearly this is a best practice that should be implemented to improve the building performance. But “UB04 Initial Commissioning…” may have a significant impact also with a 12% differential.
There are many more best practices, 44 in the utility section alone, but these examples show the power of benchmarking in making data driven decisions. Additionally, the client can be reassured that the proposed work will successfully pay off since it has worked successfully for the peer group in the second quartile.
See our June article on benchmarking maintenance best practices.