Fixed costs such as insurance, taxes, and depreciation are often not considered as an important issue or responsibility for Facility Managers. When we benchmark these expenses we sometimes hear responses to requests for the data questioning why even bother to collect it. One participant said, “Even if I did collect my fixed costs what could I do about it?”
Well, collecting the fixed cost data is quite useful and is usually of an equal cost magnitude to your operating expenses. For this year’s current FMRT benchmarking report the median cost for operating expenses is $6.95 while the median cost of fixed expenses is $6.59. If you ignore your fixed expenses you are only looking at about half the expense portfolio.
This article will
- Cover the fixed costs definitions .
- Provide some guidance and suggestions for collecting the data
- Review the expense charts for one of our studies
- Identify some best practices
Step 1—Deciding What to Measure
The information you will need to collect fixed costs is
| H1. | Building and building improvement depreciation. ($000) |
| H2. | Leasehold improvement depreciation. ($000) |
| H3. | Depreciation for furniture, building equipment, spare building system equipment (e.g., generator, chiller), and facility’s department equipment e.g. test equipment or facility’s department depreciable equipment. Do not include production equipment, computer equipment (IT), or machinery depreciation. ($000) |
| H4. | Property insurance costs necessary to protect real estate, buildings, land, and equipment for the site. ($000) |
| H5. | Taxes on the equipment covered in question H3 and all real estate taxes for the site. ($000) |
Step 2—Where can I find this information
In most organizations this information is available from the financial services / accounting group. Often they are very analytical and will be reluctant to provide data unless they have collected it exactly as specified in the survey. Our experience indicates that in most cases they will have the data, it just requires some interpolation and discussion with them to extract it from the files.
Step 3—How Do I Compare With Others
Once this information is collected it is easy to normalize the data on a unit cost basis to compare your fixed costs with others.
Normalized depreciation cost charts in the Facility Managers Roundtable Group looks like this

Normalized total fixed cost charts in the Facility Managers Roundtable Group looks like this

Step 4—Using This Information
You’ve completed your fixed costs data collection and performed the calculations. Here are a few questions you should ask yourself
- Where do you stand on these charts? Are you above the median or below it?
- Could you explain to management why your positions on the charts is just right or needs to be changed?
- What are some of the reasons that explain your positions on the charts?
Step 4—Some Best Practices
- Don’t regard fixed costs as unchangeable costs. Two of our benchmarking participants learned from the benchmarking process that they were being charged different tax rates from the same jurisdiction.
- Many organizations use their depreciation rate to help justify their capital renewal spending. If your capital renewal rate doesn’t at least equal your depreciation rate the quality of your facilities is declining.
- Fixed costs can be an important criteria in a facilities master plan in deciding which facilities to keep or close and sell.
Metrics from the Facility Managers Round Table (FMRT)
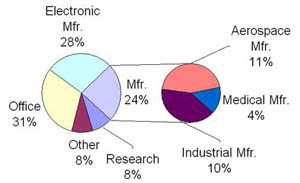
In 2004 there were 94 unique sites in the FMRT with a median size of about 1,400,000 million square feet. See the chart below to see how the group looked by industry type.
SPACE METRICS
- Space Utilization 430 Gross Square Feet per Occupant
- Cost Metrics
- Utilities $2.17 / GSF
- Custodial $1.33 / Cleanable SF
- Maintenance $1.69 / GSF
- Parking and Paving $1529 / Acre
- Groundskeeping $3405 / Acre
- Security $0.73 / GSF
- Mail Services $0.22 / GSF
- Environmental Health and Safety $0.35 / GSF
- Fixed Costs (Includes: Building, Leasehold Improvements, Furniture/Equipment) $ 4.59 / GSF
MOVE / CHURN COST METRICS
- Box Move Costs $317 / Person Moved
CUSTOMER SATISFACTION
- Satisfaction With Overall Facilities Services 3.80 on a 1 to 5 scale