Many FMs are often seeking benchmarking data to measure how their organization is performing. When asked about what they want to learn they will often reply that they would like to see a table or chart showing their buildings’ performance compared to others.
In this article, we will be looking at maintenance costs, as they are very much in the mind of today’s facility professionals. However, the methodology and analysis presented here are identical to what can be done to study other types of operating costs, such as those for utilities, janitorial, security, landscaping, etc. The past two articles were similar to this new maintenance series, except they covered utilities.
The Starting Point—Defining Your Peer Group
Most people who benchmark realize that unless the comparisons are made with a relevant peer group, the comparisons may not be of significant value to the organization. We later will explore ways of taking these comparison data to help us improve our buildings’ performance, but for right now, let’s just try to identify a relevant peer group.
For the examples that follow, we will use a very large manufacturing facility located in Florida and compare its maintenance costs with those of several different peer groups to see how its building is doing. From this type of analysis, we will learn how to define just the right peer group of buildings.
In Figure 1 below, our maintenance costs are $2.25 per gross square foot (GSF). We have shown the 1st Quartile, Median and 3rd Quartile points for reference. Without applying any filters our building’s maintenance costs are near the middle of the second Quartile.
Filter 1: Size of Facility. If we filter this sample for size of the facility (look at the right side of Figure 1), our relative performance improves with the performance approaching the first Quartile—the maintenance cost per GSF went from $1.98 to $2.12 (in other words, the larger buildings in the first Quartile had higher costs than when size was not a factor). Thus, the size of the facility is a critical factor in comparing benchmarked maintenance costs.
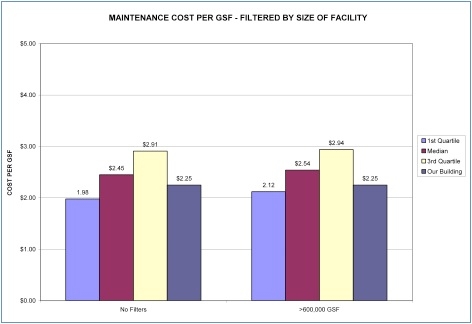
Figure 1 Maintenance Costs per GSF filtered by size of facility. The results indicate that facility size does have an impact on maintenance costs. Provided courtesy of FM BENCHMARKING
Filter 2: Type of Facility. Let’s take a look at the type of facility and see if this has a significant impact on our benchmarked costs. In Figure 2 below, the cost of our maintenance remains the same, of course, at $2.25 per gross square foot (GSF); it won’t change no matter what peer group we compare ourselves to. Again, we have shown the 1st Quartile, Median and 3rd Quartile points for reference.
Since the building size is a factor, we will leave that filter on, and now also turn on the type of facility filter. Our building’s maintenance costs are just $0.02 higher than the 1st Quartile based on this filter set—in other words, we’re almost into the first Quartile. This is starting to feel like the right peer group. The 1st Quartile performance for manufacturing facilities that also are greater than 600,000 GSF is about 13% higher than our unfiltered group, the median is about 10 percent higher. We thus would expect the maintenance costs to be higher for this filtered group.
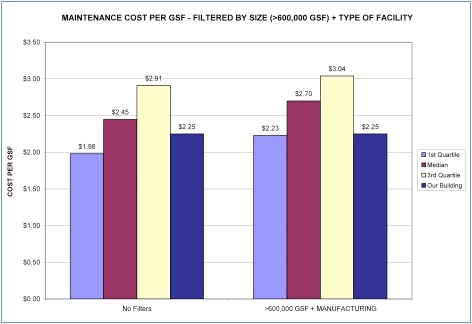
Figure 2 Maintenance Costs per GSF filtered by size and type of facility. The results indicate the both size and facility type will impact maintenance costs. Provided courtesy of FM BENCHMARKING
Filter 3: Age of Building. Let’s see if building age has a significant effect on our maintenance costs. In Figure 3 below, we add this as a third filter to our chart by looking at facilities greater than 21 years old. This makes a dramatic difference to our analysis. First, we see that our first Quartile peer group costs are about 33 percent higher ($2.60 per GSF), while our building remained, of course, at $2.25 per GSF. Thus, our building is now in the middle of the first quartile. Age of the facility clearly has a significant impact on our maintenance cost performance.
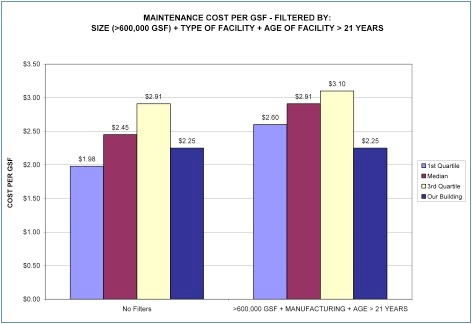
Figure 3 Maintenance Costs per GSF filtered by SIZE (>600,000 GSF) + TYPE OF FACILITY + AGE OF FACILITY > 21 YEARS. This chart shows that age of building also has a significant impact on this maintenance benchmark. Provided courtesy of FM BENCHMARKING.
More filters. What is really happening here is that the FM is realizing that looking at facilities without good peer group comparisons is a real waste of time. To do this, one needs tools to identify the most appropriate peer group(s) for each specific situation. General numbers such as the ones in this paper are a good starting point, but to make informed decisions, one will require a more detailed breakdown by criteria that affect operating costs is necessary; these criteria are really filters. Our research has indicated that there are over 60 such filters that can have an impact on a building’s performance—the trick is to identify those that apply to any given building. That is the only way one can compare the benchmarked facility to one that is best-in-class.
Here are some of the most useful filters:
- Industry type
- Age of the facility
- Climate type
- Hours of operation
- Days of operation
- Union or non-union labor
- Number of employees
- Facility condition index
In actuality, there are nearly 40-50 potentially useful filters for looking at maintenance metrics, and more that are germane to other operating costs, such as maintenance, janitorial, and security.
Benchmarking of operating costs is popular among FMs, as these are what the FM can both measure and control. More than 95 percent of operational expenses are incurred by:
- Utilities
- Maintenance
- Janitorial
- Security
It should be apparent that the same building may very well have a different peer group (set of filters) for each type of metrics being analyzed. For example, in last month’s article, on utility costs, we found that different filters worked best for our sample building.
Identifying the most relevant comparison (filter) sets, as we started to do above, yields useful information:
- We have learned which types of data on which we should focus.
- We have seen where our building stands in relation to other buildings that are truly similar; i.e., we have created a scorecard.
- We have a sense of what reasonable maintenance costs are for our facility.
However, here is what we don’t yet know and have not done:
- We don’t know if there is anything we can do differently to improve our performance further within the first Quartile.
- If there is something we can do, we don’t know what that is.
Benchmarking, when integrated with best practices, will yield the answers to the above two questions. In next month’s benchmarking article, we will show how that can work in the area of maintenance.