December 2016 — Walk thru almost any corporate facility and there is a good chance that only 20 to 25 percent of the offices will have people in them. How important is the individual space and can you effectively shrink it? Another way to consider the office space is to think of it as a factory and ask the question, “Would anyone build a factory and use only 25 percent of it.”
FMs should take a careful look at how their space is utilized and consider changing the space standard so that leased space can be shed or owned space can be sublet. Changing the space utilization is usually a complex issue but can have big payoffs for the FM organization and the company; for FMs it should be the top priority for improvement initiatives. Here is an example, using a one million square foot facility, showing why you should consider looking at space as an initiative.
Option 1 – Initiatives to reduce operating costs:
- Reduce your maintenance costs by 10% → save about $.20 per SF
- Reduce your utility expenses by 8% → save about $.25 per SF
- Reduce your janitorial costs by 7% → save about $.10 per SF
- Total annual savings is projected at $.55 per SF or $550,000
These are ambitious cost-reduction goals and need to be very carefully implemented to avoid reducing overall service levels for the occupants. Not an easy thing to do!
Option 2 – Initiatives to utilize space more effectively:
- Improve space utilization by 10% or reduce space by 100,000 SF
- Total median operating costs savings
- $6.50 x 100,000 = $650,000
- Total median fixed costs savings
(insurance, taxes, depreciation, interest)- $6.00 x 100,000 = $600,000
- Total savings from more effective space utilization………..$1,250,000
An added benefit to Option 2 is that you can choose which space to eliminate and probably would select your oldest, least effective, highest cost to maintain, facility. The cost savings would most likely be greater than the amount shown.
Further, you can modify the existing space to support the needs of the incoming workforce which do not seem to have a need for as much individual space as the current workforce. You could provide options for more teaming space and networking opportunities.
The first step is to determine if your space utilization is in the right range or can be improved? Our first graph, Figure 1, shows our space utilization performance compared with our peer group of other large facilities with a size greater than 600,000 gross square feet. This allows you to see at a glance how our facility compares with other large buildings. There are 498 buildings in this peer group with a median space utilization of 506 gross square feet per person. Our building (in yellow) is near the middle of second quartile with a space utilization of 435 gsf per person. Not a bad performance, but possibly there is also room for improvement.
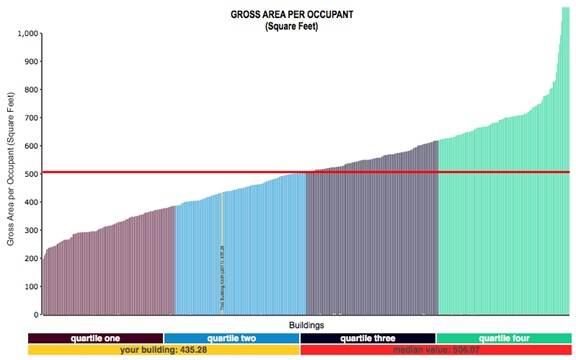
Figure 1 – Gross Area Per Occupant
Filter: Size: greater than 600,000 GSF
Provided courtesy of FM BENCHMARKING
We may want to add another filter for just office facilities to see how we compare. Figure 2 shows how our building compares with filters for office and large facilities with a size greater than 600,000. Our relative performance declines (moves to the right of the chart) a little bit. That makes sense since the Figure 1 chart had facilities of all types including manufacturing and warehousing.

Figure 2 – Gross Area Per Occupant
Filters: Type of facility: office; Size: greater than 600,000 GSF
Provided courtesy of FM BENCHMARKING
Since our building is fairly new (5 years old), what happens to our ranking if we now add an age filter. Figure 3 compares our space utilization only to only larger (>600,000 GSF) buildings, office buildings, and also newer buildings, those with an age of 4-10 years.
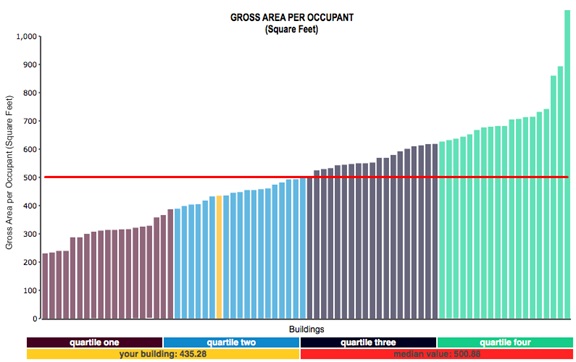
Figure 3 – Gross Area Per Occupant
Filters: Type of facility: office; Size: greater than 600,000 GSF; Age: 4-10 years
Provided courtesy of FM BENCHMARKING
Since there is not much change here between Figure 3 and Figure 2. We can conclude that the age of a facility does not have a significant effect on the space utilization.
Now, let’s consider what we would save in operating costs if could reduce our space utilization to first quartile performance. In Figure 3 above we can see that our space utilization is 435 GSF per person. First Quartile performance, the point on the graph between the purple and blue sectors is 387 GSF per person. That is about an 11% reduction in space and a modest decrease in the overall facility size of about 110,000 GSF. But the annual savings, using median cost values would be about $12.50 per GSF X 110,000 GSF or nearly $1.4 M. That is certainly something worth considering.
Conclusions
Here are some factors we’ve learned from applying various filters in our example that may affect management focus:
- Our space utilization is in the 2nd quartile.
- There is not much difference in space utilization based on building age.
- We should examine our space utilization to see if we can obtain a 10% or better improvement, which would enable us to be on the border of the 1st quartile.