Some FMs have difficulty getting started in the benchmarking process. Most have daily issues and “crisis type” problems that keep the benchmarking initiative from beginning. Also, without good comparisons you don’t really know if there even is a problem. Finally, regardless of what benchmarking program or tool you use, the task often looks formidable. Sometimes the input forms look like a medical form, not something most people want to work on unless they have to.
But it doesn’t have to be difficult and there is huge payoff to benchmarking when done on a regular basis. Here is a suggested approach to help you to get started, especially if you don’t regularly benchmark your space to see if it is being used effectively.
We have used examples from FM BENCHMARKING to illustrate how easy the process should be and this approach will allow you obtain the key output reports in the minimum amount of time.
Space utilization
First, focus on what is important! Landscaping and parking lots may get a lot user feedback, but for most organizations, you will not save enough on them to have any significant impact on your facilities budget. Since most organizations still are getting requests to cut budgets or manage with minimal increases, let’s start first by benchmarking space utilization and then trending the results over multiple years.
Here is why. You can cut 10-20% from the operating budgets in utilities, maintenance, janitorial, and security and you will save a little. But optimize your space utilization, get rid of the excess, worst quality space and you will save 100% of the operating costs. That is why we want to be sure all the space an organization has is really needed.
FMs know that hardly any department will “volunteer” to give up space. That is why you have to show good benchmarking comparisons and gather support for eliminating space. The usual reaction is, “We can’t cut it any further without making our employees unproductive.” The reality is you really don’t know if you can reduce space unless you can compare to some similar buildings and see how they are doing with their space utilization.
When comparing space utilization it would be ideal to know how other facilities are managing their space. Maybe some are operating just fine on less space per person, or maybe what is being requested of you will result in a space utilization that’s higher than anyone else.
You don’t have time to collect and input data for a benchmarking survey. What are needed are benchmarks to show how your organization is managing space. Let’s start with the Key Performance Indicators (KPIs) for space utilization. The usual KPIs for space utization are:
- GROSS AREA PER OCCUPANT
- RENTABLE AREA PER OCCUPANT
These KPIs show how your space utilization compares with others. But comparing your space utilization with everyone else may give you the wrong perspective on your performance unless the comparisons are made with a relevant peer group.
In Figure 1, we used FM BENCHMARKING LITE to create chart showing the KPIs listed above with a peer group based on your criteria. This chart shows the comparison for office facilities. There are only a few facilities at the extremely low and high ends of the chart. This suggests our data is quite credible—most organizations that participated in the benchmark understood the definitions and measured their space in a consistent manner.
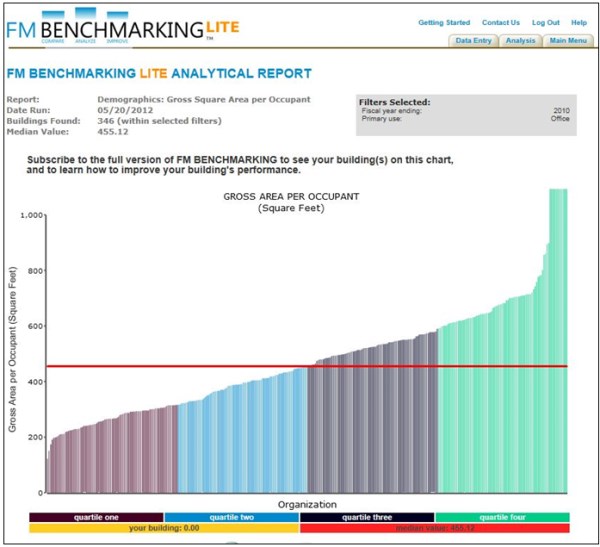
Filters: Office
This chart allows you to see at a glance how well your facility is performing its space utilization. There are 346 buildings in this peer group with a median space utilization of 455 per GSF per person (red horizontal line) and a first quartile performance of 315 GSF per person. Let’s assume you have 750 employees in your facilities and they are utilizing space at the median level. But you think you could get them to first quartile performance by subleasing some of your facilities. That would result in a space reduction of about 105,000 GSF. If your operating costs are at the median level (about $6.00/GSF) a net annual savings of about $630,000 will result. By looking at and comparing similar types of facilities, you thus will be able to make intelligent “data driven” decisions.
Does building size matter?
One other factor to consider is the building size. Larger buildings are usually not as efficient as smaller buildings since the larger buildings have more penetrations for elevators, stairs, mechanical systems, etc. Our buildings are around 160,000 GSF each so let’s turn on a filter for the facility size.
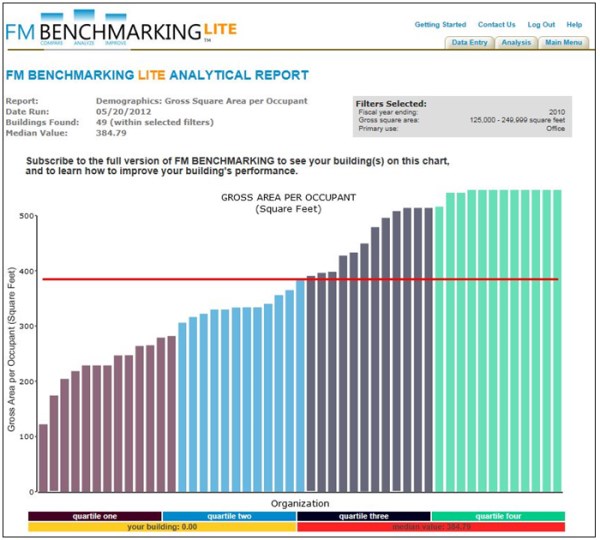
Filters: Size of facility 125,000 249,000 GSF and Site Type: Office
Figure 2 illustrates how facility size affects space utilization. There are 49 buildings in this peer group with a median space utilization of 385 per GSF per person and a first quartile performance of 306 GSF per person. Our performance of 455 GSF per person is in the 3rd quartile with this peer group… an even more compelling reason to improve our space utilization.
You can see that it isn’t always sufficient to run thru the benchmarking process just one time. To keep the portfolio running at an optimum level you need to benchmark every year and trend your performance. You probably won’t save $630,000 every year but you should be able to show a two to three percent savings across the portfolio by using all the benchmarking tools available and focusing in on specific performance issues.