One of the most overlooked aspects of benchmarking is its use to develop budgets for new facilities. Most projects focus on the construction costs and other aspects of the occupancy process such as furniture, the move in, and equipment. Often overlooked is the most expensive cost of any facility—the long-term operating expense.
Can you easily show a budget amount for the new facility’s operating costs? Did you know that data entered in a benchmarking system can be used to document your utilities, maintenance, janitorial, and security costs? For the building life, operating costs often represent more than 90% of the life-cycle costs. Construction costs often represent less than 10% of the life-cycle costs but receive most of the attention. This is a backwards approach for the budget development process.
Using benchmarking is a really straightforward process that shows the importance of the FM position in the organization and the impact of construction decisions over the life-cycle of the building. Without good benchmarking comparisons, you may not realize that operating costs can be reduced, your level of service is too low, or which best practices may have the most impact on improving the overall performance of the operating budget. As you can see, a case easily can be made for benchmarking that will justify the minor amount of staff time required.
We have used examples from FM BENCHMARKING to illustrate how easy the process should be. This approach will allow you obtain the key output reports in the minimum amount of time. In the following example, we benchmarked an office facility for the key components of:
- Maintenance
- Utilities
- Janitorial
- Security
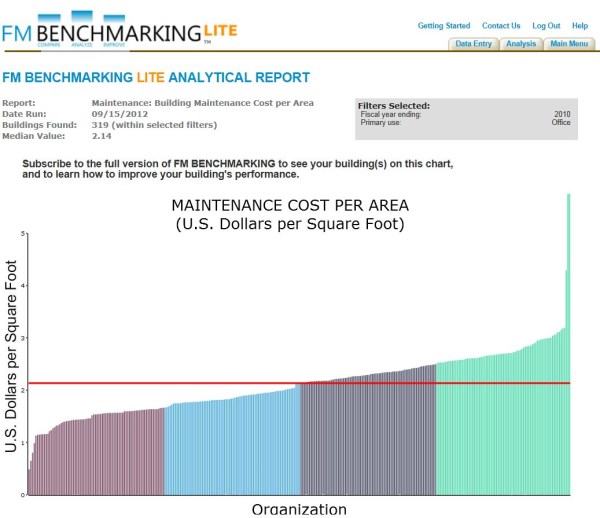
Comparing your maintenance cost per area may give you the wrong perspective on your performance unless the comparisons are made with a relevant peer group. For a quick analysis we can utilize FM BENCHMARKING LITE to create a chart showing the maintenance cost per area of a good peer group. Here, for example, is a chart showing the maintenance cost per area for office facilities. Starting with the maintenance benchmarking we used FM BENCHMARKING LITE to compare office facilities that were comparable to the building under construction.
Figure 1 shows the third quartile maintenance cost of $2.33 per square foot, median maintenance cost of $2.14 per square foot, and the first quartile maintenance cost of $1.63 per square foot. When the building is turned over to facilities, what will be the maintenance costs? This isn’t a rhetorical question since the range between the 1st and 3rd quartile is $.70 per SF. On a one million square feet facility, that represents an annual $700,000 difference and over 50 years the difference in a net present value analysis is more than $50 million.

Filters: Type of facility (Office)
The case can be made to focus our efforts on implementing the key aspects that will influence the overall operating costs. Maintenance services are compared on a cost per area basis. Since for most maintenance activities, the labor utilization is a major component, usually between 70 and 85 percent, we usually look at labor utilization or FTE (full time equivalents) normalized against the facility area.
Using FM BENCHMARKING LITE gives an idea of the performance of a good peer group but it doesn’t directly show their building’s performance or provide a table of the implemented best practices by quartile. This obviously can’t be done until a building is built. Once the building becomes a reality and it has its own metrics, one can apply benchmarking to show which best practices to implement to improve the building’s performance.
To assure that our new facility reaches first quartile you could just start reducing costs by reducing staff and limiting the purchase of new parts and equipment. However, this usually isn’t too effective. Usually the quality of the services will decline and you will start receiving more complaints and eventually your costs will be excessive.
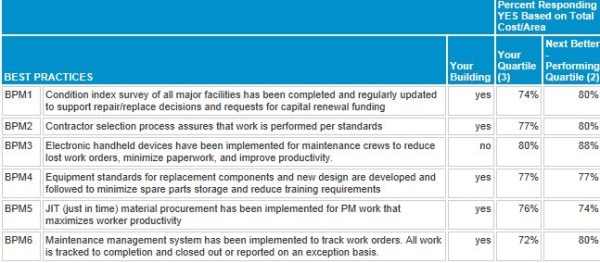
A much better approach would be to develop a strategy to reach 2nd quartile performance in a set period of time and then continue to consider more of the best practices until the organization is at 1st quartile performance. An important step is to evaluate which best practices other organizations in this peer group have implemented to reach the 2nd quartile. Figure 2, which is a partial list of the best practices from the full version of FM BENCHMARKING, shows some of the best practices you have implemented in our sample building (third column from the right), what has been implemented by the peer group in your quartile (second column from the right) and the next better quartile (last column).

Filters: Primary Use: Office
Using the results from this table, the facilities group can make proven recommendations for maintenance services that would help achieve first quartile performance. Again, this is win-win for both the construction process and the FM. The owner will achieve cost savings from the maintenance improvements and improved levels of service; the contractor will improve their profitability by more effectively utilizing the benchmarking process, and there will be improved occupant satisfaction which benefits everyone.