In last month’s article we reviewed how benchmarking can be used to justify your maintenance staffing. This month’s article will review how you can use benchmarking to validate that your janitorial contractor is staffing appropriately to clean your facility or even use benchmarking to evaluate a bid for services.
Almost every organization goes through a contract rebid for janitorial services. Often the specification will require the janitorial contractor to provide a staffing plan. Since labor comprises between 85% and 90% of janitorial costs, the vendor with the lowest proposed staffing levels usually has the lowest costs. But the lowest staffing level proposal may not be appropriate for the cleaning of your facilities. You can use the same type of benchmarking data we used for maintenance to determine if the existing contractor is adequately staffed for the required cleaning services.
What is needed for this evaluation? Most surveys will collect their staffing benchmarks on a full-time equivalent (FTE) annual basis. Depending upon the level of detail, that could be:
- Total staff
- Staffing by internal and contract workers
It is our experience that most organizational staffing level questions come down to total staffing levels. In the case of janitorial services, nearly all the cleaning will be provided by the contractor so in most cases total staff and staffing by contract workers will be the same value.
Determining and keeping the appropriate janitorial staffing levels is probably one of the more critical decisions that facilities managers and the senior leadership team can make. Janitorial contractors have said off the record, “We will propose to staff the job at whatever level is needed to obtain the bid. But the client must realize the vacuum cleaners, mopping, and dusting are ineffective when performed at the speed needed to cover the job with too few workers.”
We have an example to illustrate how easy and valuable the process should be and how you can avoid the problem of too much or too little staff. This approach allows you obtain the key output report of staffing per cleanable area.
Note that when we use area in janitorial benchmarks, it is in terms of the area cleaned, and not necessarily the net, rentable or gross area of a building. Usually, the value for the “area cleaned” comes directly out of the cleaning contract. It recognizes that not all areas of a building get cleaned on a regular basis.
Figure 1 shows the staffing level performance compared with a group of facilities that most closely matches our own. This allows you to see at a glance how our facility compares with other office buildings that are greater in size than 600,000 gross square feet. The overall performance ranges from about 35,000 SF to 9,000 SF cleaned per person. About half the group is in the second and third quartiles between approximately 20,000 and 18,000 SF cleaned per person. This is appropriate staffing range to assure the facility is adequately cleaned.
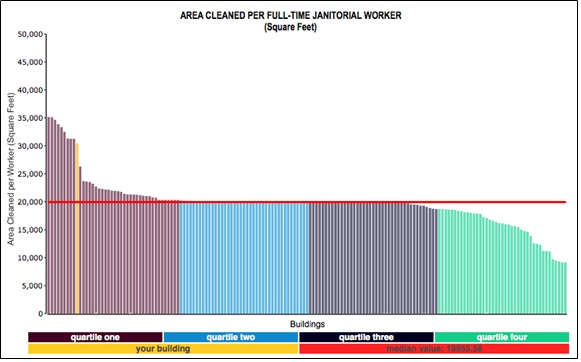
Our building is shown in yellow in the first quartile with a value of 30,450 SF cleaned per worker. Our costs are also in the first quartile and the facility, when compared with others in our peer group, appears a little dirty. This may be appropriate if the company is going through financial issues, or we may want to reconsider increasing our staffing level to bring up the quality of the cleaning. This is an example of where being in the first quartile is not always a good thing.
Another option would be to consider the scope work. Perhaps the trash doesn’t need to be emptied every day or the carpets vacuumed every other day. Either way, we can use benchmarking to support our decision-making.